Showing posts with label Market. Show all posts

Friday, October 26, 2012

Corn : Update

We have been following the progression of price in Corn futures. If you missed my original thoughts on this market I recommend reading them before continuing. You can find that information by clicking here.


The following series of charts are of the ETF of Corn, ticker symbol CORN instead of corn futures due to the fact that I took a position right before the futures market closed and I didn't want to carry a position overnight given that futures actively trade between 6 pm - 3 pm est., (the bulk of the session while I sleep) and  the potential for further downside risk as you can see from the following charts.


My initial work called for a w.(ii) decline after the completion of w.(i). There are two possible counts for the termination of w.(i) that give rise to two possible entry points into the market. The following chart analysis is from an actual trade in CORN. I will be sharing this trade and thoughts with readers so that they can learn how I am using elliott wave.

NOTE: THIS IS NOT A TRADE RECOMMENDATION (see risk disclosure and disclaimers) before proceeding.


The following chart is my preferred wave count where w.(ii) is unfolding in a zig-zag correction. W.c = w.a @  $48.68 and terminates in the vicinity of the previous 4th wave of one lesser degree. This would be a text-book trade if my analysis is correct. Notice that the .618 retracement of w.(i) lies just below at $47.53 as well as an open gap. Both may provide support if the price continues to subdivide to the downside. 

The Trade

Buy:  200 shares @ $47.62
Filled at 47.66
Slippage (.04)
Initial Target: $52.71 with much higher potential. 
Stop: $47.50 


Nothing is perfect or guaranteed in speculating in the market and this chart shows that there is another downside target that I must account for. In this alternate count, w.(ii) unfolds in an expanded flat , as w.(i) terminates at $48.6 instead of $48.68. The w. (ii) bottom isn't expected until $47.04, where w.c = 1.618 w.a. That's certainly a deep correction but it is a valid count so long as w.(ii) doesn't exceed the origin of w.(i) at $46.85.

Under this interpretation, I would place my stop at $46.75 with the full knowledge that I'm wrong in a big way if $46.85 breaks. As such, prudent risk management calls for the actual trade under the preferred count because it offers me less initial risk and if wrong my maximum exposure is $24 + commission and slippage. 

As always, I'll continue to follow this trade so readers can see how I manage the trade. 

I hope you found this post helpful and ...


Best of Trading

======================================================================
ElliottwaveLive is not an investment advisory service or broker dealer. None of its contributors are registered investment advisors, licensed stock brokers or CTA's. The author may hold short term and long term positions in the futures, stocks and ETF's discussed herein. The author may also trade around those positions which may be in direct conflict with your positions. Complete trade disclosures of the contributor’s holdings are posted at www.elliottwavelive.blogspot.com. See Trader Disclosure. 

Trade at your own risk. The blog site, Newsletter and all other information, material and content accessible from this Site (collectively, the "Content")  provided herein provides the context for market analysis with respect to a market's, a security or a commodity's general position utilizing the Elliott Wave Principle. The Content contained herein are the opinion and general comments of the author and is based upon information that Mr. Sinibaldi considers reliable but neither ElliottWaveLive nor he warrants it's completeness or accuracy and it should not be relied upon as such. Mr. Sinibaldi or ElliottWaveLive (collectively, referred to as “EWL”) are not under any obligation to update or correct any content provided on this website. Any statements and or opinions are subject to change without notice. The content and comments contained herein neither purports nor intends to be, specific trading advice. It has been prepared without regard to any particular person's investment objectives, financial situation and particular needs. Information should not be considered as an offer or enticement to buy, sell or trade. 

A more and comprehensive Risk Disclaimer and Disclosure Statements is available within the left margin of this blogsite.   
======================================================================

Fair Disclosure Notice: I am LONG CORN but don't have any position in corn futures markets related to this article. 


Wednesday, September 19, 2012

ES Update: After the Bell

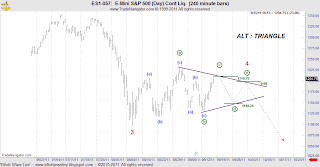
Earlier today I provided an intraday update for the emini S&P where I was looking for a further decline in the market as show in the chart shown below.


To learn more about my initial thoughts, click here . 


Moving forward, the market put in a new high .25 above my w.(b) crest then proceeded to close weak for the session. I've adjusted the w.(b) label accordingly.

The above chart is a daily session charts that has been updated. 

A Hypothetical Trade

For tomorrow, my elliott trade plan is simple. 

(1) A loss of critical support bolsters my preferred wave count and negates any thought of an alternate triangular pattern developing. Downside targets may be achieved before any re-test of the 1468 high.

(2) If I was short this market from above 1459, my initial stop would have been placed above 1468. Based upon the close, I would move my stop to (1) tick above the w.(b) crest. Any advance above the w.(b) crest at this juncture would most likely produce an assault of 1468 and heighten the probability of a further advance to new highs in this market. 

Note: neither of the charts presented take into account the globex session therefore you should cross reference cited levels with those charts.

There is allot of news flow tomorrow so I'll be monitoring this one closely.  

Best of Trading

======================================================================
ElliottwaveLive is not an investment advisory service or broker dealer. None of its contributors are registered investment advisors, licensed stock brokers or CTA's. The author may hold short term and long term positions in the futures, stocks and ETF's discussed herein. The author may also trade around those positions which may be in direct conflict with your positions. Complete trade disclosures of the contributor’s holdings are posted at www.elliottwavelive.blogspot.com. See Trader Disclosure. 

Trade at your own risk. The blog site, Newsletter and all other information, material and content accessible from this Site (collectively, the "Content")  provided herein provides the context for market analysis with respect to a market's, a security or a commodity's general position utilizing the Elliott Wave Principle. The Content contained herein are the opinion and general comments of the author and is based upon information that Mr. Sinibaldi considers reliable but neither ElliottWaveLive nor he warrants it's completeness or accuracy and it should not be relied upon as such. Mr. Sinibaldi or ElliottWaveLive (collectively, referred to as “EWL”) are not under any obligation to update or correct any content provided on this website. Any statements and or opinions are subject to change without notice. The content and comments contained herein neither purports nor intends to be, specific trading advice. It has been prepared without regard to any particular person's investment objectives, financial situation and particular needs. Information should not be considered as an offer or enticement to buy, sell or trade. 

A more and comprehensive Risk Disclaimer and Disclosure Statements is available within the left margin of this blog site.   

======================================================================

CFTC RULE 4.41 - HYPOTHETICAL OR SIMULATED PERFORMANCE RESULTS HAVE CERTAIN LIMITATIONS. UNLIKE AN ACTUAL PERFORMANCE RECORD, SIMULATED RESULTS DO NOT REPRESENT ACTUAL TRADING. ALSO, SINCE THE TRADES HAVE NOT BEEN EXECUTED, THE RESULTS MAY HAVE UNDER-OR-OVER COMPENSATED FOR THE IMPACT, IF ANY, OF CERTAIN MARKET FACTORS, SUCH AS LACK OF LIQUIDITY, COMMISSION AND SLIPPAGE. SIMULATED TRADING PROGRAMS IN GENERAL ARE ALSO SUBJECT TO THE FACT THAT THEY ARE DESIGNED WITH THE BENEFIT OF HINDSIGHT. NO REPRESENTATION IS BEING MADE THAT ANY ACCOUNT WILL OR IS LIKELY TO ACHIEVE PROFIT OR LOSSES SIMILAR TO THOSE SHOWN.NO REPRESENTATION IS BEING MADE THAT ANY ACCOUNT WILL, OR IS LIKELY TO ACHIEVE PROFITS OR LOSSES SIMILAR TO THOSE DISCUSSED WITHIN THIS SITE, SUPPORT AND TEXTS. OUR POST(S), SHOULD BE USED AS LEARNING AIDS ONLY AND SHOULD NOT BE USED TO INVEST REAL MONEY. IF YOU DECIDE TO INVEST REAL MONEY, ALL TRADING DECISIONS SHOULD BE YOUR OWN. 
======================================================================

Fair Disclosure Notice: I do not have a position in any of the aforementioned futures markets or securities related to this article.     


Friday, August 24, 2012

Silver Tongue Chart : Update

Silver is popping today and as I mentioned a few days ago, the metals had my full attention due to the fact that the FED minutes might indicate further QE. The following link Elliott Wave Live: Silver Tongue Chart  provided my initial comments on Silver.


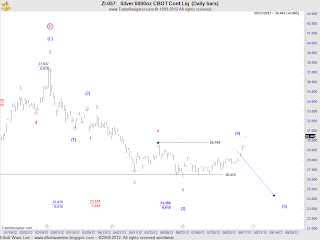
The above chart shows that I was looking for an up, down sequence to complete a w.C=w.A move to 23.47. That didn't happen. However, that doesn't mean that my count is invalidated. The count invalidates on a print above the w.(1) low of 31.222 due to the fact that in motive waves, w.(4) never moves beyond the end of w.(1).  Yet, other clues suggest this interpretation is wrong. Here's why.....

  • Applying time factors diminishes the probability of this count as the length of time consumed by w.(4) is much longer than w.(2). W.(2) is 8 bars long while w.(4) has reached 41 bars and is still incomplete. 
  • From a proportional view, w.(4) is much larger.  


So what are the other scenarios? Are we in full bull mode or is this a counter trend move that will be fully retraced?


The alternate that I offered in my initial post has been applied to the weekly chart level as it's possible that the alternate scenario will play out and if so, price will make new lows. The fact of the matter is that it doesn't really matter if this market is in full bull mode because I'm looking to buy this market anyway and the location of my entry as well as my stop placement is what matters.

Once this advance ends the next move down will tell all. Should it be in three waves, I'm a buyer against the lows. If the decline is in five waves, then I'm a buyer at lower levels.

As always, I'll continue to monitor this chart and provide updates so that you can learn how I'm applying Elliott Wave Principle.

Best of Trading


======================================================================
ElliottwaveLive is not an investment advisory service or broker dealer. None of its contributors are registered investment advisors, licensed stock brokers or CTA's. The author may hold short term and long term positions in the futures, stocks and ETF's discussed herein. The author may also trade around those positions which may be in direct conflict with your positions. Complete trade disclosures of the contributor’s holdings are posted at www.elliottwavelive.blogspot.com. See Trader Disclosure. 

Trade at your own risk. The blog site, Newsletter and all other information, material and content accessible from this Site (collectively, the "Content")  provided herein provides the context for market analysis with respect to a market's, a security or a commodity's general position utilizing the Elliott Wave Principle. The Content contained herein are the opinion and general comments of the author and is based upon information that Mr. Sinibaldi considers reliable but neither ElliottWaveLive nor he warrants it's completeness or accuracy and it should not be relied upon as such. Mr. Sinibaldi or ElliottWaveLive (collectively, referred to as “EWL”) are not under any obligation to update or correct any content provided on this website. Any statements and or opinions are subject to change without notice. The content and comments contained herein neither purports nor intends to be, specific trading advice. It has been prepared without regard to any particular person's investment objectives, financial situation and particular needs. Information should not be considered as an offer or enticement to buy, sell or trade. 

A more and comprehensive Risk Disclaimer and Disclosure Statements is available within the left margin of this blog site.   


Thursday, August 9, 2012

ES Setup From Low


Often pre-market setups aren't worth bothering with due to lack of volume and the fact that on any given day economic reports are due out. Therefore, I send most of my time scanning markets for potential trade setups that I might consider during the regular session.

Today, I came across this set up in the eminis, that was perfect for illustrating how I use elliott wave to trade. 

Note: This is a hypothetical trade that was made for training purposes!

DETAILS:
  1. I saw a pattern that I recognized as a w-x-y that completed where w.y = w.w at 1393.75 with .786 support  and 1390.5 swing low directly below the market. 
  2. Entry at 1395.25, (2) cars, initial stop at 1393.50


My initial target for this trade was 1398, then a test of 1400's. 


Dropping to the 1-min chart, you can see the first objective was reached where I took off one contract for 2.25 pts or $112.5. I got caught on the second contract looking for the market to subdivide higher. Notice the initial decline from 1398 was sharp! I could have exited earlier but I wanted to illustrate  how the market always gives you another opportunity to get out before it buries you. The key is "not to panic"!

Since all market movement is either in three or five waves, you look to get out on the first retracement. As shown, I exited just above the .382 retracement at 1396.75 for 3/4 pt or $75.

You might ask why I didn't wait for the .618 to exit.  Something to ponder! What if you're still waiting for that level? 


TRADE RESULTS:

(2) contracts
3.75 pts profit
$187.50


Best of Trading 


======================================================================
ElliottwaveLive is not an investment advisory service or broker dealer. None of its contributors are registered investment advisors, licensed stock brokers or CTA's. The author may hold short term and long term positions in the futures, stocks and ETF's discussed herein. The author may also trade around those positions which may be in direct conflict with your positions. Complete trade disclosures of the contributor’s holdings are posted at www.elliottwavelive.blogspot.com. See Trader Disclosure. 

Trade at your own risk. The blog site, Newsletter and all other information, material and content accessible from this Site (collectively, the "Content")  provided herein provides the context for market analysis with respect to a market's, a security or a commodity's general position utilizing the Elliott Wave Principle. The Content contained herein are the opinion and general comments of the author and is based upon information that Mr. Sinibaldi considers reliable but neither ElliottWaveLive nor he warrants it's completeness or accuracy and it should not be relied upon as such. Mr. Sinibaldi or ElliottWaveLive (collectively, referred to as “EWL”) are not under any obligation to update or correct any content provided on this website. Any statements and or opinions are subject to change without notice. The content and comments contained herein neither purports nor intends to be, specific trading advice. It has been prepared without regard to any particular person's investment objectives, financial situation and particular needs. Information should not be considered as an offer or enticement to buy, sell or trade. 

A more and comprehensive Risk Disclaimer and Disclosure Statements is available within the left margin of this blog site.   


HYPOTHETICAL TRADING DISCLOSURE

CFTC RULE 4.41 - HYPOTHETICAL OR SIMULATED PERFORMANCE RESULTS HAVE CERTAIN LIMITATIONS. UNLIKE AN ACTUAL PERFORMANCE RECORD, SIMULATED RESULTS DO NOT REPRESENT ACTUAL TRADING. ALSO, SINCE THE TRADES HAVE NOT BEEN EXECUTED, THE RESULTS MAY HAVE UNDER-OR-OVER COMPENSATED FOR THE IMPACT, IF ANY, OF CERTAIN MARKET FACTORS, SUCH AS LACK OF LIQUIDITY, COMMISSION AND SLIPPAGE. SIMULATED TRADING PROGRAMS IN GENERAL ARE ALSO SUBJECT TO THE FACT THAT THEY ARE DESIGNED WITH THE BENEFIT OF HINDSIGHT. NO REPRESENTATION IS BEING MADE THAT ANY ACCOUNT WILL OR IS LIKELY TO ACHIEVE PROFIT OR LOSSES SIMILAR TO THOSE SHOWN.NO REPRESENTATION IS BEING MADE THAT ANY ACCOUNT WILL, OR IS LIKELY TO ACHIEVE PROFITS OR LOSSES SIMILAR TO THOSE DISCUSSED WITHIN THIS SITE, SUPPORT AND TEXTS. OUR POST(S), SHOULD BE USED AS LEARNING AIDS ONLY AND SHOULD NOT BE USED TO INVEST REAL MONEY. IF YOU DECIDE TO INVEST REAL MONEY, ALL TRADING DECISIONS SHOULD BE YOUR OWN.


Saturday, August 4, 2012

Coffee Update and a Review of Wave Personality


After a volatile month of July, a review of the the decline from 192.2 has not yet proven itself. One could come to the conclusion that this market remains under pressure and you would probably be correct in your assessment. To what extent?

If the pressure truly remains to the downside and 150.10 will be surrendered, price action over the next two trading days must exhibit the personality of a third wave move.

From the 240 min chart, I have labeled what type of price action represents a third wave move AND what would not constitute one. In a third wave, we should see several days of heavy selling as price extends to the downside in long bars. This would bolster my labeling and my interpretation offered in my personal trade plan.You can read more about that trade plan at :  Elliott Wave Live: Coffee Anyone?

If we don't start seeing this market extend and see what I have described as "Not This", the possibility exists that either the bottom is already in or a more complex corrective move may be unfolding.

In conclusion, the correct use of Elliott Wave balances price with wave personality (structure). So make sure that you apply the applicable rule of wave personality to your wave labeling efforts. You'll see better results!

I hope you found this education tip helpful and...

Best of Trading


======================================================================
ElliottwaveLive is not an investment advisory service or broker dealer. None of its contributors are registered investment advisors, licensed stock brokers or CTA's. The author may hold short term and long term positions in the futures, stocks and ETF's discussed herein. The author may also trade around those positions which may be in direct conflict with your positions. Complete trade disclosures of the contributor’s holdings are posted at www.elliottwavelive.blogspot.com. See Trader Disclosure. 

Trade at your own risk. The blog site, Newsletter and all other information, material and content accessible from this Site (collectively, the "Content")  provided herein provides the context for market analysis with respect to a market's, a security or a commodity's general position utilizing the Elliott Wave Principle. The Content contained herein are the opinion and general comments of the author and is based upon information that Mr. Sinibaldi considers reliable but neither ElliottWaveLive nor he warrants it's completeness or accuracy and it should not be relied upon as such. Mr. Sinibaldi or ElliottWaveLive (collectively, referred to as “EWL”) are not under any obligation to update or correct any content provided on this website. Any statements and or opinions are subject to change without notice. The content and comments contained herein neither purports nor intends to be, specific trading advice. It has been prepared without regard to any particular person's investment objectives, financial situation and particular needs. Information should not be considered as an offer or enticement to buy, sell or trade. 

A more and comprehensive Risk Disclaimer and Disclosure Statements is available within the left margin of this blog site.   

Sunday, July 29, 2012

ES_F Update:

The Manipulators Have Struck Again!


Over the past few days, the governing bodies of Europe have successfully talked up the markets, in particularly,.... Friday's price action was ridiculous! Yet, if readers had been watching my tweet stream, on July 24, I tweeted, " ES_F currently at 1319.5-1320.75 support . If it fails we could see a slide to 1305."


Support actually held and the market hasn't looked back. Two days later, Mario Draghi manipulated the market with his comments to support the Euro at all costs. Friday, more chatter and the market exploded (see chart). The simple fact is that the US equity market response to economic news has increased dramatically!


The above chart is the last chart that I left readers with. Read more about my initial thoughts made on July 18, 2012. 


I have modified the wave labeling and included a price channel. The initial failure to achieve 1397.5 from the 7/19 high of 1376 brought initial concerns to the wave count. The subsequent decline heightened my level of concern when 1320 held (see previous comments above), to end w. (b). The advance from w.(b) low has extended beyond the corrective price channel and suggests the presence of a third wave. As such, it would be difficult to maintain an corrective stance to 1397.5 as price would clearly remain outside of the channel to meet my initial projection where w.y = w.w @ 1397.5. Therefore, I'm updating the possible scenarios that I'm paying particular attention to. 


Note: These patterns below are subject to multiple interpretations which may require further development in order to conclude that any particular pattern is of higher probability than the others. 


1. First, I think it's important to actually look at the CASH market. Here is a possible leading diagonal scenario that would explain the initial advance. You'll notice that there is a clear distinction between the emini contract high on 7/19 and the CASH.  The price objective at 1399.48 would only be applicable IF the July 19 high of 1371.21 is w.A and where w=C of w.2 = .618 w.A. Complicating matters is the thrust from the 7/24 low.... w.C should not have an increasing slope when compared to w.A. Therefore, this scenario is suspect.  


2.  Under scenario 2, the leading diagonal is now labeled w.1 and subsequent price action should follow the script laid out. IMO, the test for this scenario occurs on any meaning full retracement. To maintain this wave count, critical support of 1329.24 can't be violated.


3. Finally, I'm keeping in mind that this larger quarterly pattern may be applicable and what we are seeing right now is the beginning of a five wave sequence to end w.d.


Let's see how things develop. 


Best of Trading

 ======================================================================
ElliottwaveLive is not an investment advisory service or broker dealer. None of its contributors are registered investment advisors, licensed stock brokers or CTA's. The author may hold short term and long term positions in the futures, stocks and ETF's discussed herein. The author may also trade around those positions which may be in direct conflict with your positions. Complete trade disclosures of the contributor’s holdings are posted at www.elliottwavelive.blogspot.com. See Trader Disclosure. 

Trade at your own risk. The blog site, Newsletter and all other information, material and content accessible from this Site (collectively, the "Content")  provided herein provides the context for market analysis with respect to a market's, a security or a commodity's general position utilizing the Elliott Wave Principle. The Content contained herein are the opinion and general comments of the author and is based upon information that Mr. Sinibaldi considers reliable but neither ElliottWaveLive nor he warrants it's completeness or accuracy and it should not be relied upon as such. Mr. Sinibaldi or ElliottWaveLive (collectively, referred to as “EWL”) are not under any obligation to update or correct any content provided on this website. Any statements and or opinions are subject to change without notice. The content and comments contained herein neither purports nor intends to be, specific trading advice. It has been prepared without regard to any particular person's investment objectives, financial situation and particular needs. Information should not be considered as an offer or enticement to buy, sell or trade. 

A more and comprehensive Risk Disclaimer and Disclosure Statements is available within the left margin of this blog site.   

Sunday, October 23, 2011

Trading Lessons: Accurately Analyzing MACD Divergences

Every Friday I dedicate my day to working in a Trading Lab to either developing new trading ideas or enhancing an existing trading strategy. This weeks trading lesson is based upon two hypothetical trades that I made during Friday's session and focuses on accurately analyzing MACD divergences and how the indicator can be used to confirm your elliott wave analysis.

Numerous professional traders dispel the use of divergence analysis but as you will see, when used to compliment your elliott wave analysis, divergences can help confirm your count and assist in determining market tops and bottoms.

I hope the examples contained within the following video will encourage you to do your own analysis and become confident to act on divergence analysis.


Best of Trading


Friday, September 16, 2011

Before the Bell: More Manipulation of Markets

Announcements:

As a result of my ongoing efforts to build my new website, some readers may have noticed that my intraday Tweets and content posting has been cut back to just M-W-F. I appreciate your understanding and patience.

When my schedule permits, I will make every effort to follow the market intraday and make blog entries.


The Emini S&P:

Here's a quote I read from the Associated Press, "Global stocks remained buoyed by the decision of five top central banks to provide unlimited amounts of dollar loans to the banking sector, easing one of the concerns driving the recent turbulence in financial markets of late."

While this persistent manipulation is frustrating in that it blows up short term wave counts.... it doesn't change the larger degree bearish view.


In Wednesday's Market Pulse, I features two existing elliott wave counts, of which the chart above was invalidated  on a break above 1199.75.

However, as in any corrective structure, there are still multiple ways of labeling the structure and often the count is unclear, sometimes until it's complete. This is why attempting to trade a complex structure can be hazardous to your account.

In this weeks edition of Heard on the Street , I'll be showing how the intraday price action still fits within the larger degree bear trend. Until then....


... here is the other interpretation, the contracting triangle. Notice how I was looking for a decline yesterday that never materialized and the wave structure continued to subdivide. Thanks Central Bankers!


Here is the updated chart through yesterdays close. The ideal target remains where w.c circle = .618 w.a circle at 1210.75.

Technicals already show divergence therefore the wave structure at this juncture is mature. Let's see how the lower intraday time frames look at the open.


Best of Trading

Wednesday, September 7, 2011

Chart of the Day: XBI

A Bearish Warning


The stock market has fallen hard since May 3, 2011. Most sectors and stocks never escape the claws of a bear market. Today's chart of the day is ticker symbol $XBI , the S&P Biotech ETF. The chart, in my opinion, provides a warning that the resumption of the bear trend is underway in the Biotech sector. It also clearly illustrates an ongoing five wave sequence.


At the weekly chart level, XBI completed cycle w.b at $75.93 and fell hard along with the broader market. To date, three waves have been completed, possibly four if w.(4) doesn't turn into a complex pattern.

If the interpretation is correct, and w.(4) is complete, then price should  make a new low to where w.(5) = .618 w.{(1)-(3)} at $51.32 to complete w.1 circle.

As the wave pattern and count suggests, a long term bearish view of this ETF would be appropriate that eventually draws price well below w.a ($42.95).

I'll be making periodical updates to this post for those readers who are interested in following along.

Best of Trading


Sunday, August 7, 2011

Heard On The Street : Panic and Chaos

ATTENTION: New readers and loyal subscribers....

...Imagine the chaos and panic that may hit world markets --
 then decide how you'll protect your money on Monday...


Traders,

The past week has certainly been challenging to say the least and after the S&P downgraded U.S. debt, any glimmer of hope that traders had at Friday's close may evaporate.

What if the market is unable to catch a bid come Monday morning? Watching the market free fall without a plan to protect yourself won't be fun. After all, most portfolios haven't recovered since 2007 and the losses could be much greater this time around.

Since my July 17, 2011 call , I’ve been warning readers that the end of the bear market counter-trend rally was coming. In fact, my 2007-2011 analogy of the emini S&P demonstrated the fractal nature of the market, how the pattern would progress and the targets associated with the call. In fact, I've sent out multiple updates on Twitter and through my Monday- Wednesday-Friday blog posts keeping you abreast of the markets. 

I'm guessing that subscribers like you either protected yourself from the market's recent carnage or were already prepared to discuss it with your investment advisor and take advantage of it as a result of my forecasts ...

... but if my forecast didn't raise your eyebrows because you don't realize the benefits of Elliott Wave Analysis I can only hope that the events of this past week will change your mind.

Thursday’s 512 point Dow and 60 point S&P loss was just part the beginning, not the end. And if you are a bull, the losses you’ve taken so far could get much, much worse. 

What if you had know in advance, like my readers, that my target level for the S&P was 1166? What if you had that number in your pocket since the July 30, 2011 call and that the level was briefly surpassed on 8/4/2011 before staging a minor reversal.

It’s not too late for you to realize the educational benefits that I provide and the power of the Elliott Wave Principle. Sitting on your hands and waiting for the Central Banks around the world to come up with another ingenious plan is the worst move you could make.


Introducing Signal Watch RT  ® -- a premium service -- providing insightful, real - time intraday elliott wave analysis


There's one request that I've heard from readers again and again and that's more live, hands - on real-time wave analysis. Now if that sounds like something you might want to hear more about, Signal Watch RT ®, may be the solution you're looking for. You'll know what the market is likely to do and when it is likely to do it.

Next month, watch for a complete list of features and benefits and pricing but today I want to thank you personally for joining our community of  Elliott Wave Live readers. Roll up your sleeves, lock the door behind you, watch the video below NOW, then peruse my achieves (lower bottom right fold) and join my blog if you agree that my work is insightful.
Best of Trading,

Mike Sinibaldi 


Thursday, August 4, 2011

Silver:Revisited

Is There Still Silver In These Hills?


The following chart is part of my initial commentary on July 28, 2011. As you can see my analysis for the termination point of the corrective rally was incorrect as price exceeded my invalidation point of 41.97.


Here is the updated chart through today's close. From the w.iv circle low of 39.13, a small five wave advance where w.v = .382 w{i-iii} at 41.92 took place and is in agreement with the 1.618 RF extension of w.B red. Also note that the bearish reversal that occurred today is also what one wants to see if a top is in... i.e. a swift retracement of w.v in less time than it took to complete.


Additional evidence of a w.(2) crest can be found by looking at the MACD technical study that shows a divergence as noted by the green lines.  This market should remain under selling pressure in the days to come.

Best of Trading


Wednesday, August 3, 2011

The Market Pulse


The market appears to have hit a bottom today at 1230.25 which was just points above the .382  retracement (1229.25) of the swing between May 2011 high of 1367.25 and the July 2010 low of 1006. Notice that prices are retesting the neckline of the Head and Shoulder pattern.


From a 20 min perspective, I've identified the low as w.iii circle, implying that I'm looking for w.iv to the upside, followed by a fully retracement. However, it's often difficult early on when deciding with absolute certainty which wave is the extended wave. Final reconciliation of the count will be influenced by the depth of the retracement from the 1230.25 low.

Most recent price action has been identified as a double zig-zag that should push higher to 1271-73 range with 1273 representing a .382 retracement of w.iii circle. There is also resistance at 1262 that could cap the rally but I believe the higher probability exists where w.y =w.w at 1271.75.

Tomorrow is the Jobless Claims and Friday is Non Farm Payrolls. I'm sure everyone will be looking for further evidence that the economy is on weaker footing. It will be interesting to see the extent of the bullish resolve to push this market higher in the face of strong headwinds.


Best of Trading

Monday, August 1, 2011

The Market Pulse

Tonight's blog post will be a brief follow up to my lengthy weekend video. As I begin this post, the House has voted favorable for the raising of the debt ceiling and the market reaction is muted.

Essentially, the table has been set. We know the levels... bearish below 1252.25 and bullish above 1352.75.


Looking back on today's wild ride, the bullish move was called for in the weekend video. My intraday levels for the retracement were 1307.5 - 1321.25 (not shown on chart). In the ON session, prices actually reached beyond the first target to 1309.5 before failing.  Once the daily session began, within the first five minutes of trade, the market had gapped up to 1304.75 and then proceeded to lose all bullish momentum. It fell hard in response to a poor ISM number, as fear of a double dip recession are starting to emerge... or was it also that the the market hit a wall at the 50 sma that even I missed?

Even though the market closed off the lows, price is now below the 200 sma. As I stated in my weekend video, " institutional investors may not be willing to defend their positions". Tomorrow will be a defining moment for them. What they do will certainly influence trade in either direction.


I can make a case that we made five completed waves in today's session but I need to see tomorrow's trade to more accurately determine how today's move fits into the larger wave pattern. I'll update readers with my thoughts as soon as I am able to draw a high confidence conclusion. Until then look up in a three wave affair to typical .5 - .618 retracement levels.


Best of Trading

Saturday, July 30, 2011

Heard on the Street : Should We Take This Sell Signal Seriously?

Fellow Traders,

The clock is ticking on the U.S. debt situation and the crisis is escalating fast...

If you have been following the market since 2008, you know that all the stimulus plans, bank bailouts and the Federal Reserve's Quantitative Easing Programs (QE) haven't turned the economy around and the financial crisis is still with us.

The data released on Friday showed that the Consumer Confidence Report Fell to 63.7 in July from 71.5 in June... and the government's first estimate of second quarter GDP, advanced at a weaker-than-expected 1.3 percent rate. Growth in the fourth quarter of last year was 2.3 percent annual rate, not the 3.1 percent that our government wanted us to believe. The first quarter was also revised lower.

That doesn't sound like an economy that is humming along or recovering. Does it?

The final straw may be the ongoing soap opera bickering between Congress and President Obama. No wonder why investors are selling!

Should We Take This Recent Sell Signal Seriously...

or

... Is This A Wall Street Debt Ceiling Head Fake?


In this weeks edition of Heard on the Street, you'll learn about:


#1: The 2007-2011 Analogy: A Fractal Comparison

1. This one bearish chart could be the most important charts you look at all year.

2. Based upon my original published research on July 17 and current price action.... next week could bring a tidal wave of selling into the markets.

3. From my review of the S&P futures, this market could drop to 1166!


#2: A Review of Elliott Wave Counts:

1. I'll revisit all the counts and let you know which ones remain viable alternate counts and or why they have been eliminated. I'll even cover some counts that I'm certain readers are working that should be eliminated immediately.

2. I'll provide an outline for you to know where the battle will be won or lost, what the wave patterns will look like and the levels of demarcation where turning points may occur.

What if My Bearish Forecast is Wrong ?

Unfortunately, I can't tell which scenario will play out. As you know, trading is a game of probability. All I can do is provide you with the information to make an informed decision of how to trade this market. What I hope to convey to you in this video is that an enormous opportunity exists whether the outcome is bullish or bearish.  Proper identification and knowing where to act will be the difference.

So please watch it today.


Best of Trading

P.S. - If you appreciate my work, you can show your appreciation by sharing it either directly from my "Share It" tab on the top right hand side of my blog; by re-tweeting it or by direct linkage to my site. Other methods require permission consistant with copyright, trademark, and other intellectual property laws and treaties.  (See policy below video).


---------------------------------------------------------------------------------------------------------------------------

Except as provided in the next sentence, the Materials may not be copied, reproduced, modified, published, uploaded, downloaded, posted, transmitted, or distributed in any way, without EWL’s prior written permission. You may download one (1) copy of the Materials on a single computer only for your personal, non-commercial, internal use. You may not (i) modify the Materials or use them for any commercial purpose, or any other public display, performance, sale, or rental, (ii) decompile, reverse engineer, or disassemble software materials, (iii) remove any copyright notice or other proprietary notices from the Materials, or (iv) transfer the materials to another person.
---------------------------------------------------------------------------------------------------------------------------

Wednesday, July 27, 2011

The Market Pulse

The Bull / Bear Debate Continues

Introduction:

Earlier today I posted a special video addition of Heard On The Street that updated the current status of the 2007-2011 analogy and my expectation for the progress of the pattern. If you haven't watched that video, I recommend that you do so because this update expands upon the content provided and breaks down the intraday wave count from a bearish view. One without the other will not make much sense. You can listen to the call here.


The Bearish Case:


Here, the bearish interpretation at the daily chart level, has me looking for continued selling pressure followed by a three wave advance to complete w.E. A bounce may intervene but the larger trend shall remain down.


At the intraday chart level, this chart depicts the anticipated progress of the pattern (please click on the video link to obtain for further commentary).


The Bullish Case:

In my opinion, two bullish interpretations hang by a tread and one or both may be eliminated within the next few days, leaving no bullish counts. 


At the daily chart level, the running triangle is still viable. Today, the market gaped down but gaps are not usually found in second waves, they're found in third waves. Also, according to the rules and guidelines of the Elliott Wave Principle, w.2 can't exceed the origin of w.1.  A break of 1291.25 negates the viewpoint that w. 5 was underway.  Only a break of 1252.25, the w.c low would finally extinguish this view. 


The second pattern is the running flat. Flaws already exist in this interpretation. If you recall, w.4 overlapped w.1 but not on a closing basis. A small degree of leeway was granted as the DOW and NASDAQ did not confirm the same structure. That was then. Prints below 1291.25 negate this interpretation.

Let's see what unfolds tomorrow.


Best of Trading