Showing posts with label Price Channel. Show all posts

Thursday, February 7, 2013

Keep It Simple : DJIA


Yesterday I posted this chart on Twitter and asked what do you see? I received several interpretations from readers which were correct but responses didn't touch upon the real takeaway that I had in mind. Quite possibly, additional interpretations were made by many others.

The purpose of this post, as a follow up, is to highlight some of the conclusions that can be made without an elliott wave overlay to evaluate a market.

  1. The trend up
  2. Price remains bound within a large channel

The initial trendline drawn from the 2009 low extending to the first intermediate trough (July 2010) had a slope of ascent that was unsustainable and resolved in August 2011 with a break of the trendline. This lead to the second intermediate correction. The second intermediate trough forced an analyst to redraw the initial trendlines (now blue lower and parallel upper return line). 

From August 2011 low, price rallied higher but has failed to:

  • retest the underside of the initial trendline and 
  • reach the upper boundary of the return line

That is your first significant sign that the trend is slowing!

This progression of slowing momentum is illustrated with each set of channel lines. Notice that in each advance, price failed to reach the upper return lines confirming a deceleration of trend. 

Note: You may also confirm this by using your favorite momentum indicator. 

At yesterday's close, price is testing the upper return line of the last drawn channel. This is a resistance zone and the test thereof may bring in responsive selling. We'll see. 

CONCLUSIONS

My point is, the chart shows traders and investors that the advance that began in 2009 is maturing and will continue in the direction of the prevailing trend until evidence manifests which prove otherwise. It doesn't matter what the elliott wave count is or what degree of trend.

While I assume most are still looking for entry into this market, given the mutual fund inflows. However, prudent investors might review their existing positions and contemplate the use if trailing stops, taking some profit and above all looking for reversal patterns!


I hope you found this helpful and as always....


Best of Trading


======================================================================
ElliottwaveLive is not an investment advisory service or broker dealer. None of its contributors are registered investment advisors, licensed stock brokers or CTA's. The author may hold short term and long term positions in the futures, stocks and ETF's discussed herein. The author may also trade around those positions which may be in direct conflict with your positions. Complete trade disclosures of the contributor’s holdings are posted at www.elliottwavelive.blogspot.com. See Trader Disclosure. 

Trade at your own risk. The blog site, Newsletter and all other information, material and content accessible from this Site (collectively, the "Content")  provided herein provides the context for market analysis with respect to a market's, a security or a commodity's general position utilizing the Elliott Wave Principle. The Content contained herein are the opinion and general comments of the author and is based upon information that Mr. Sinibaldi considers reliable but neither ElliottWaveLive nor he warrants it's completeness or accuracy and it should not be relied upon as such. Mr. Sinibaldi or ElliottWaveLive (collectively, referred to as “EWL”) are not under any obligation to update or correct any content provided on this website. Any statements and or opinions are subject to change without notice. The content and comments contained herein neither purports nor intends to be, specific trading advice. It has been prepared without regard to any particular person's investment objectives, financial situation and particular needs. Information should not be considered as an offer or enticement to buy, sell or trade. 

A more and comprehensive Risk Disclaimer and Disclosure Statements is available within the left margin of this blogsite.   
======================================================================

Fair Disclosure Notice: I do not have a position in any of the aforementioned futures markets or securities related to this article. 


Sunday, July 29, 2012

ES_F Update:

The Manipulators Have Struck Again!


Over the past few days, the governing bodies of Europe have successfully talked up the markets, in particularly,.... Friday's price action was ridiculous! Yet, if readers had been watching my tweet stream, on July 24, I tweeted, " ES_F currently at 1319.5-1320.75 support . If it fails we could see a slide to 1305."


Support actually held and the market hasn't looked back. Two days later, Mario Draghi manipulated the market with his comments to support the Euro at all costs. Friday, more chatter and the market exploded (see chart). The simple fact is that the US equity market response to economic news has increased dramatically!


The above chart is the last chart that I left readers with. Read more about my initial thoughts made on July 18, 2012. 


I have modified the wave labeling and included a price channel. The initial failure to achieve 1397.5 from the 7/19 high of 1376 brought initial concerns to the wave count. The subsequent decline heightened my level of concern when 1320 held (see previous comments above), to end w. (b). The advance from w.(b) low has extended beyond the corrective price channel and suggests the presence of a third wave. As such, it would be difficult to maintain an corrective stance to 1397.5 as price would clearly remain outside of the channel to meet my initial projection where w.y = w.w @ 1397.5. Therefore, I'm updating the possible scenarios that I'm paying particular attention to. 


Note: These patterns below are subject to multiple interpretations which may require further development in order to conclude that any particular pattern is of higher probability than the others. 


1. First, I think it's important to actually look at the CASH market. Here is a possible leading diagonal scenario that would explain the initial advance. You'll notice that there is a clear distinction between the emini contract high on 7/19 and the CASH.  The price objective at 1399.48 would only be applicable IF the July 19 high of 1371.21 is w.A and where w=C of w.2 = .618 w.A. Complicating matters is the thrust from the 7/24 low.... w.C should not have an increasing slope when compared to w.A. Therefore, this scenario is suspect.  


2.  Under scenario 2, the leading diagonal is now labeled w.1 and subsequent price action should follow the script laid out. IMO, the test for this scenario occurs on any meaning full retracement. To maintain this wave count, critical support of 1329.24 can't be violated.


3. Finally, I'm keeping in mind that this larger quarterly pattern may be applicable and what we are seeing right now is the beginning of a five wave sequence to end w.d.


Let's see how things develop. 


Best of Trading

 ======================================================================
ElliottwaveLive is not an investment advisory service or broker dealer. None of its contributors are registered investment advisors, licensed stock brokers or CTA's. The author may hold short term and long term positions in the futures, stocks and ETF's discussed herein. The author may also trade around those positions which may be in direct conflict with your positions. Complete trade disclosures of the contributor’s holdings are posted at www.elliottwavelive.blogspot.com. See Trader Disclosure. 

Trade at your own risk. The blog site, Newsletter and all other information, material and content accessible from this Site (collectively, the "Content")  provided herein provides the context for market analysis with respect to a market's, a security or a commodity's general position utilizing the Elliott Wave Principle. The Content contained herein are the opinion and general comments of the author and is based upon information that Mr. Sinibaldi considers reliable but neither ElliottWaveLive nor he warrants it's completeness or accuracy and it should not be relied upon as such. Mr. Sinibaldi or ElliottWaveLive (collectively, referred to as “EWL”) are not under any obligation to update or correct any content provided on this website. Any statements and or opinions are subject to change without notice. The content and comments contained herein neither purports nor intends to be, specific trading advice. It has been prepared without regard to any particular person's investment objectives, financial situation and particular needs. Information should not be considered as an offer or enticement to buy, sell or trade. 

A more and comprehensive Risk Disclaimer and Disclosure Statements is available within the left margin of this blog site.   

Tuesday, July 17, 2012

Natural Gas Chart Update


The chart above is what I left readers in my video.....  Elliott Wave Live: Is It Really Time To Be Bullish Natural Gas?

From the weekly chart, price action has not made any significant advance that confirms a bullish w.1 and negates a w.(4) counter-trend interpretation.


Dropping to the daily chart level, what we do know, as of the time of this post, is the following:

  • Price remains within a corrective price channel.
  • The move from w.(3) low appears to be in a sharp, three wave zig-zig.
  • Price traded to 3.06, very near the level where w.c = w.a @ 3.088

While each bullet point favors a corrective interpretation, only price can confirm a wave count. A price break of 2.659 (key support) may bolster my interpretation, but other bullish scenarios could be applied. Therefore, according to my personal trade plan, I can afford to remain market neutral as described within my original post. 

Best of Trading


======================================================================
ElliottwaveLive is not an investment advisory service or broker dealer. None of its contributors are registered investment advisors, licensed stock brokers or CTA's. The author may hold short term and long term positions in the futures, stocks and ETF's discussed herein. The author may also trade around those positions which may be in direct conflict with your positions. Complete trade disclosures of the contributor’s holdings are posted at www.elliottwavelive.blogspot.com. See Trader Disclosure. 

Trade at your own risk. The blog site, Newsletter and all other information, material and content accessible from this Site (collectively, the "Content")  provided herein provides the context for market analysis with respect to a market's, a security or a commodity's general position utilizing the Elliott Wave Principle. The Content contained herein are the opinion and general comments of the author and is based upon information that Mr. Sinibaldi considers reliable but neither ElliottWaveLive nor he warrants it's completeness or accuracy and it should not be relied upon as such. Mr. Sinibaldi or ElliottWaveLive (collectively, referred to as “EWL”) are not under any obligation to update or correct any content provided on this website. Any statements and or opinions are subject to change without notice. The content and comments contained herein neither purports nor intends to be, specific trading advice. It has been prepared without regard to any particular person's investment objectives, financial situation and particular needs. Information should not be considered as an offer or enticement to buy, sell or trade. 

A more and comprehensive Risk Disclaimer and Disclosure Statements is available within the left margin of this blog site.   


Thursday, September 22, 2011

Flash Update: ES_F


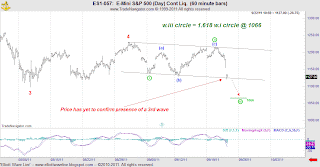
Last night I told readers that 1228 was the key downside level to watch. Based upon the ON session, the opening gap and the fact that price has traded below 1228  increases the odds are that the triangle interpretation will be eliminated and the other working interpretation ( a fifth wave decline) has prevailed.


At the 60 minute chart level we can see how price has touched the lower boundary of the price channel and that I'm working a w.iii circle count. However, just because I count it as such doesn't mean that I can confirm it due to the fact that price has yet to confirm the presence of a third wave i.e. by pushing through the lower boundary of the channel. Once it does, odds are that the internal structure is properly labeled and that an initial target of 1066 should be reached.

Let's see what happens.

Tuesday, September 6, 2011

Before the Bell: Updated $ES_F Chart


At the 120 minute chart level, price has challenged the lower boundary of the corrective price channel. If this interpretation is correct, a decisive break will occur that draws prices to new lows.


And here is my current elliott wave count for the decline that began at 1229.75.  I'm giving this count some wiggle room as there are other ways to count this (see ALT) but I believe that the triangle w.4 red breaks up the subdivision of w.(3) well. The depth of the counter-trend rally that is currently taking place should confirm the count. If correct, I do not expect price to print above the .50 retracement level. Should price make a much deeper retracement, but not exceed 1207.5 (the invalidation point for the overall interpretation), then most likely the ALT count is correct.


Let's see what develops.


Best of Trading