Tuesday, June 28, 2011

The Market Pulse

Reminder Announcement :

1. I will be vacationing from June 28 - July 12 and this is my last blog post until July 13. 


The Market:


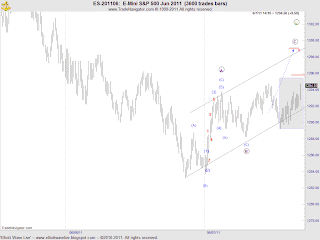
Here is an updated chart at the 240 minute level where I have w.4 complete. The most recent price action from that crest is uncertain and the possibility exists that a triangle is forming which would slightly alter the wave labeling as w.4 would still be unfolding. Regardless, the larger trend will remain down and requires another print below1252.25 to complete a five wave sequence.


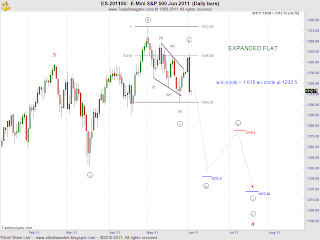
Here is the triangle interpretation at the 60 min. chart level. A print below 1261.25 negates this view and implies that w.5 was unfolding under the previous interpretation and that the rise from the 1257 low is just w. ii of w.5. ( see 240 min chart level above).

Best of Trading

Monday, June 27, 2011

Silver Gold Ratio : Is Risk on or Off?


Commodities are not fairing any better today. Corn, Wheat, Gold, Oil, Silver and Copper are all adding to their losses.

I thought that I would add this chart of the Silver/Gold Ratio to show a measurement of  the Risk. Currently traders are risk adverse as the ratio came crashing down from what was a parabolic run from 2009 to April 2011. As you can see, or in this case barely see, a new low has been made starting this week therefore the unwindeing continues even though the USD is weak. 

I've added an oval around the bar for visual assistance. Note that structural support at 114 was tested and has now failed on the second test with today's gap to the downside. Look for this are to provide resistance against any attempt to rally. The ratio should work it's way lower between 97-108.

Watch those levels for any sign that sentiment has changed back to "Risk On"

Best of Trading


Sunday, June 26, 2011

Heard On The Street

Announcements:

1. I will be vacationing from June 28 - July 12 and the last blog post will be on Monday June 27, 2011.  Regular post will resume on July 13.  

2. During my analysis of Oil I failed to mention that the charts used that pertaining to my comments were "forward contracts " of CL3-057 because of limited date on the QM mini Gold forwards.

As I reviewed the markets on Saturday morning I realized that many are on the brink of big moves. Volatility has picked up and as traders we welcome it. In this weeks video edition of Heard On The Street my hope is to identify the key areas where significant opportunities may exist. As always, these are my opinion and not a trade recommendation. You should read my complete Risk Disclaimer and Disclosure Statement contained on the left hand side of the blog.

The markets that I'm covering are: Emini SP futures, Corn, Wheat, Soybeans, Gold, CRB Index, Gold, Oil and the EUR-USD.

Best of Trading


Thursday, June 23, 2011

$ES-F: Updated Chart


Here is the updated chart per a readers request. Note the overlap of w.a has occurred based upon the globex session (see chart below). I've also noted the key area to watch for today of 1261.25 as well as the 200sma of 1261.75. Breaks below these levels would indicate that w. 4 was confirmed complete and that w.5 down is unfolding. Should 1261.25 hold, the possibility exists that a more complex correction for w.4 was still unfolding. SEE last night's Market Pulse for further details.


And here is the globex session showing that price has traded to 1263.25. Notice that the all session front contract has different levels of significance.


Best of Trading

Wednesday, June 22, 2011

The Market Pulse: Why it's so important to make another lower low!!!


On Monday I left readers with this chart showing my expectations for the remainder of w.4. The Market continues to follow my preferred count of an expanded flat. With three waves complete, the Market has arrived at a critical juncture.


A Bullish Stampede

If the Bulls are to make a run to new highs, then today's high of 1293.75 must be taken out tomorrow and price must enter into the territory of w. 1 low of 1308.75 (red dashed line) to negate any further bearish stance. Should this happen, wave overlap would occur and confirm that the decline from 1367.25 was in three waves... a corrective move that will eventually be fully retraced regardless of what larger pattern develops.

A Bearish Mauling

If the Bears are to remain in control of this Market, it is imperative that a lower low be made during the next swing down. My reasoning is that a new low meets the minimum criteria of a five wave structure that would confirm that an interim trend change had occurred.  Several of the wave relationships for the termination of w.5 would place a new low at or just slightly below 1252.25 that I am considering a lower probability at this point. However, since w.2 was a zig-zag, w.4 should be a sideways correction due to the rules of alternation. I can't rule out the possibility that the move from 1252.25 - 1293.25 is actually part of a more complex pattern where w.4 isn't complete.  Only a print below 1261.25 would confirm that w.4 was complete and that w.5 was unfolding.

If w.5 is unfolding, the more likely termination point for w.5 is where w.5 = .618 w.{1-3} @1222.75

Let's see what develops tomorrow.

Best of Trading


Monday, June 20, 2011

The Market Pulse

Tonight's commentary will be brief as the S&P is following the comments made in this weekend's edition of Heard On The Street quite well.


As a quick reminder, I'm looking for w.4 to terminate at 1288 and today's price action was a step in the right direction.


This 3600 tick chart was presented over the weekend to show the subdivisions of w.4 in which I thought w.b was complete but said that I would need to see price move beyond 1270 to have absolute confirmation that w.b had ended.  As you can see the market made another low in what was probably w. z of a triple zig-zag (not labeled) to complete w.b at 1256.25.


At the 240 minute chart level, w.c is underway and w.c = w.a at 1284 which is shy of our initial target of 1288. The .382 retracement level of 1281.75 closes the gap and is a level of agreement (see chart below).


For tomorrow, continue to look up and watch price action surrounding 1281.75.

Best of Trading

Saturday, June 18, 2011

Head On The Street: #USD, $ES-F, #CrudeOil

The Market's are certainly more volatile. In the coming weeks we'll know whether the most recent declines are corrective or the resumption of the Bear Market. In the meantime, find out where Crude Oil, the USD and the S & P are headed.


Friday, June 17, 2011

USD : A thought


The most recent price action for DX-F can be interpreted as either bullish or bearish at the higher time frames. Here's the 120 min. chart level for consideration. I'll be devoting a considerable amount of time on the USD and Euro during this weeks video edition of Heard On The Street.

Best of Trading


Wednesday, June 15, 2011

The Market Pulse


The following chart was what I left readers with on Monday. As expected, the Market rallied but failed to reach my target. In addition, the correction ended before the .382 time relationship of 6/16/11.  The implications are that w.i circle wasn't complete and that the wave is still extending. Often it's difficult to determine which wave is extended but the fact that the retracement was shallow leads me to believe that the rally was actually a forth wave within w.i circle.

I'd like to point out that the "degree of trend" is for illustration purposes. As you know I'm working an expanded flat or as an alternate count, the top is in place. Once I can establish which count correct, I'll adjust the degree to properly reflect the structure.  


I've relabeled the subdivisions of w.3 red to reflect the shallow retracement that ended just shy of the .50 retracement of w.(iii). If this labeling is correct then w.(v) is underway but t looks incomplete. Look sideways to up in the ON session, followed by a last push lower to completed w.(v).

Best of Trading

Tuesday, June 14, 2011

Chart of The Day: $AUD-USD


At the monthly chart level, the $AUD-USD appears to have completed Grand Supercycle w.IV where the internal structure breaks down in a w.(c) = w.(a) at 1.1086 relationship. A loss of .9705 would confirm that the top is in, clearing the way for a massive impulsive move to the downside.


This view aligns commodity currencies, like the Aussie Dollar,  to the recent strength in the USD (not shown) and the most recent weakness in the CRB Index.


Australia is a large exporter of gold, copper and wheat  and there is a high degree of correlation between the AUD and these markets. With the wave count calling for a decline in the currency against the USD, one would expect that the price of correlated markets to also decline. Needless to say, each of the corresponding commodity charts are bearish.


Monday, June 13, 2011

The Market Pulse


At the 360 min chart level, the market has finally reached the vicinity of our target of 1257. The subdivisions count well for an initial five wave decline from w.2 to complete w.i circle. 

For the ON session and into tomorrow's trade look up. A print below 1259.5 would invalidate this view. If w.3 is subdividing, then w.ii circle should be a sizable retracement to either the .5 or .618 retracement of w.i circle. The correction should unfold in a zig-zag where w.a should have decent thrust to the upside that should carry to the previous forth and test the underside of the channel line at 1295.5. At a minimum, the pattern should not complete before 6/16/11.


Let's see what develops.

Best of Trading


Heard On The Street

ANNOUNCEMENTS:

  1. You'll notice a few changes to my video productions. I'll be adding a table of contents so that readers have the choice of either viewing the entire video or select specific areas of interest.
  2. I'd like to thank everyone who provided feedback on my blog. Of those comments, here are a few requests that I would explore further.
  • Several readers have asked for more intraday forecasts of the ES futures market's direction. What other Markets would you be interested in receiving on an intraday basis?

  • What is the best method of providing intraday forecasts? Flash Alert or Live Trading Room?

Please comment directly to this feed if you have a google account or send a Twitter direct message to @elliottwavelive .


========================================================================

THE MARKETS:

The broader US indices have decline for six straight weeks. News headlines have quickly soured and concerns about a global growth slowdown remain. The Nasdaq and the Russell 2000 both turned negative for the year and there's just not buying interest at this point.

The question remains... are we witnessing a correction or an escalating situation that could lead to another crippling economic downturn? To find out, watch this weeks video edition of Heard On The Street.

Friday, June 10, 2011

$ES-F: Intraday Update


Yesterday the Market pushed down to just above the first target for a w.i circle of 1271.25 and bounced. At the time of my previous post I indicated that I would have preferred for the market to reach the lower target as it would set up a better trading opportunity on a retest of the channel line. When that didn't happen I thought that w.(v) of w. i circle was complete as I could count a five wave decline and that w.ii was underway. The minor rally from 1273.75 - 1288.50 was weak and today's decline clearly opens the door to re-evaluate the internal structure of the decline from w.(iv). Given that the two upper targets have been met, look for a possible the test of 1257.

Look for further updates later tonight as well as my long term outlook published on Sunday.

Best of Trading

Wednesday, June 8, 2011

The Market Pulse


Yesterday, the market reached our short term w.(iv) target. I have relabeled my chart to represent the larger degree so that my wave labels will be consistent with the higher time frame labeling that I use.  Nothing has changed regarding the subdivisions or any previous targets identified at the intraday, daily or weekly level. 

At the 360 min chart level w.v of w.i circle is underway and appears to be very mature. I believe that downside potential is limited. I have shown the typical termination points for w.v. Ideally, I would like to see the lowest target reached that would complete w.i circle and set the stage for a countertrend rally to once again test the the lower boundary of the price channel. This area would represent the origin of a third of a third wave which, by nature, are the most violent and travel the farthest distance in the shortest amount of time.


From a technical perspective, the Market remains severely oversold and is due for a bounce. Look for that to occur as w.v completes. Although I didn't touch upon this in my Trading Lesson (Parts I and II) of How to use an Alternate Count, notice how the 20 - sma provided resistance for w.(iv) at 1295.5. I'll be looking for the same upon the next encounter.


Let's see what develops early on tomorrow and continue to work the larger expanded flat count.


Best of Trading

How to Use an Alternate Count : Part II

Yesterday I received a DM from a Twitter follower. His concern was that Bernanke's might announce QE3 in his speech and cause the market to rally as in the QE2 announcement. After a brief conversation, I turned my attention to following a market call that I made and then I thought..... there's a great lesson unfolding that illustrates what I had just said in private hours ago. I hope he the saw the post.

This is Part II , that covers the market action since we last spoke. If you missed Part I, click here.


This is the last chart in Part I of the hypothetical trade. At the time there were several warning signs that developed that cause me concern and stops were moved up to 1289 guaranteeing a minimum  3.25 profit per contract if the stop is hit. (see Part I for details).


The market continued to rally in a choppy manner to 1294.75. If a trader was managing the stop as suggested ... the stop should have been 1291.25 at this point.


Here are the final subdivisions for w.iv circle where the wave pattern unfolded as a double zig-zag rather than a simple ABC that was called for in the trade plan. By adopting an alternate count we were able to remain in this trade. The pattern terminated  at 1294.75 just below where w.(C) of the second zig zag = w.(A) at 1295.75.

The trade was stopped out at 1291.25 for a profit of 5.25 per contract. If a trader wasn't using the Elliott Wave Principle,working an alternate count, and managing stops.... look what followed! That's why trading what is happening now and what you see is a must for successful trading. The Market provided all the clues to successfully manage this trade all we had to do is watch. 

I hope you found this information helpful and best of trading.

Tuesday, June 7, 2011

Today's Trade Provides a Practial Application on How to Use an Alternate Count

If the objective of every trade plan is to identify levels for buying and selling the market, then according to Robert Prechter Jr., "without Elliott, there appear to be an infinite number of possibilities for market action. What the wave principle provides is a means of first limiting the possibilities and then ordering the relative probabilities of possible future market paths" (1) thus the preferred wave count. An alternate count is nothing more than my second best wave count that also describes either the past, present or future movement of the market but in another context.

When I'm providing a wave interpretation for this blog, I'm always utilizing the preferred count. I remain open to evaluating price structure that is contrary to my preferred count and adapting an alternate wave count that realigns price with a known wave pattern. Should my analysis be unable to identify a clear count, readers are made aware of the uncertainty of the analysis.

Conversely, as traders, we do not have that luxury. The preferred wave count is my template for how I believe the trade should unfold. While I can't be certain that the market will oblige my best wishes, I MUST trade what I see NOT what I want to happen. Should the market's price action prove my preferred count wrong, either I get stopped out or the adoption of an alternate count allows me to stay with a trade, albeit defensively, depending on my entry, existing profit/loss and stop placement.

On June 5, 2011 call, ElliottWaveLive called for continued weakness in the eminis for Monday's trade.


At the 240 minute chart level, the close of yesterdays trade as well as the market technicals and subdivisions of the most recent wave called for for a three wave countertrend rally to end w.iv circle for today's trade.


A Hypothetical Trade


In the ON session, the market began to rally and traced out w.(A) and w.(B) providing the initial evidence that price action may be following the preferred count. A trade initiating a long trade at 1286 STOP 1283.5 (1 tick below the origin of w.(A) would be targeting the predetermined levels of 1298 - 1299 and unfold as a zig zag.


Price reached w.A circle at 1293.75 and began to fall. According to the previous chart, I was looking for a zig-zag to unfold and complete near the 50% retracement of 1288.5. While w.B circle actually was a flat correction, the fact that the corrective phase ended at the target and just below w.A circle provided a trader with the confidence in real time to stay in the trade. Here's why... the low of w.B circle was 1288.25 and overlapped the high of w.(A) at 1288.75...  another clue that the entire move is corrective.


Price then rallied from the w.B circle low to new highs.  At this point, price hit 1294.75 , where w.C circle = .618 w. A circle. The protective stop is moved to one tick below w.B circle at 1288. The retracement from 1294.75 was deep and took out the 1291 swing low... a warning sign that something may be wrong.

It's here that trading what you see must take over. Subsequent price action is choppy and contains numerous overlapping waves. My trade plan called for a five wave advance for w.C circle without overlap.... it's not.....  a second warning that the entire corrective move from 1283.25 to 1294.75 may be complete or that a more complex correction is unfolding. At a minimum,  I'm moving stops to just below the last swing low  of 1289.25 and lock in profit while looking to identify an alternate count that realigns me with the price action. I may also consider trailing my stop in a defensive manner under each higher swing low and let the market take me out of the trade.

In conclusion, the trade plan accurately identified an area suitable for buying the market, yet price has failed to reach our price objective at this time or do so in the manner that was called for. By having a clear expectation of what should unfold we remain flexible, objective and know where we're wrong as traders.

As part two of this lesson, I'll provide updated charts in a separate post so the trade can be followed.

I hope you found this information helpful and best of trading.


(1) Elliott Wave Principle, Frost and Prechter, page 94.

ES-F: Intraday Update


here is the updated 3600 tick chart with typical Fibonacci extensions for w.C circle terminal of w. iv circle....


and the updated 240 min chart level. Bias remains targeting the .382 level for a possible turn lower.

Best of Trading


ES-F: Before the Bell .... Flash Alert


In last night's call I detailed an anticipated move to the .382 retracement level that would occur either in the ON session of for today. If you missed the call, click here to read more.


The 3600 tick charts shows that the market is working a corrective move where w.B = ..5 w.A at 1288.5. Thereafter, expect another move to the upside that will unfold in five waves where w.C = w.A at 1299 to complete w.iv (see  240 minute chart level above). Note this is agreement level as well as the test of the lower boundary of the price channel (not shown).

Let's see if the scenario plays out.

Best of Trading


Monday, June 6, 2011

The Market Pulse

Tonight's post will be a follow up on the analysis made in the weekly wrap up. If you missed the video or want to review it again to compare it to what transpired today, click here


Just before the closing bell I left readers with this intraday chart update. What is exciting about today is that price confirmed the presence of a third wave by closing below the lower boundary of the price channel. Furthermore, the preferred count i.e. the expanded flat increases in probability as price extends lower.


The running triangle remains the alternate count. Price has reached the .618 common retracement level and where w.c = w.a at 1287.25. So here would be where the market must prove itself or the count may likely eliminated by weeks end.


At the 60 minute chart level, the market is oversold. Notice that I have placed Bollinger Bands with a channel setting of 2 sd dev.  that should contain 95% of all price data. Near term, I am expecting a bounce to relieve the oversold condition.


The intraday wave count suggests that a counter trend rally may unfold either in the ON session or tomorrow and may offer a possible trade set up where the underside of the channel is retested before selling pressure would resume. This also would relieve the oversold condition.

So look for w.iv circle to reach an optimal level where w.iv circle = .382{w. (.i-.iii)} and the lower portion of the previous 4th wave between 1295.5- 1298.75.

Best of Trading


$ES-F Updated Chart


The Market remains under pressure and price action is following the script for an expanded flat. Here is the updated chart from yesterday's edition of Heard On The Street. For today I was looking for a break of the lower boundary of the price channel. Assuming the market closes below this key are has very bearish implications.


I'll cover today's move on an intraday basis as well as identify a potential short opportunity in tonight's edition of the Market Pulse. In the interim, let's see how the Market closes. 

Best of Trading.

Sunday, June 5, 2011

Heard On The Street

ANNOUNCEMENTS

I'd like to ask my readership for a bit of advice. In July 2010, I started blogging with a focus on the emini S&P. My analysis now follow numerous Market's around the world and I would like to know if there are any particular market's of interest that you would like me to discuss more frequently or begin coverage of. Also, today's daily and weekly commentary are vastly different in the fact that the body of work is much more detailed as well as utilizes video. I would greatly appreciate it if I could get some suggestions as to how to improve the blog or what changes you would like to see that can add value. For those who are interested e-mail me at mikesinibaldi@yahoo.com or DM me at @elliottwavelive on Twitter.

Watch my weekly video wrap up where I'll be covering the emini S&P, the EUR-USD, Crude Oil and the FTSE 100.

Best of Trading


Thursday, June 2, 2011

Before the Bell: Updated Chart of $ES-F


This chart supplements the commentary that I made last night.  The price action from the low is choppy and contains wave overlap. That's a corrective move that when complete, will be fully retraced? I've labeled the wave structure from the low as a completed w.(iv) ? but given the shallowness of the retracement, i.e typical forth wave corrections retrace to the .383 retracement, I don't want to get faked out. Therefore waiting for a break of w.x confirms that w.(iv) has completed and another round of selling will occur.

From last night's post I cited 1300 -1303 as a target area to complete w.(v). If w.(iv) is complete,
w.(v) = .382 w. { (i) - (iii)} at 1303.25.

Trade above 1313.75 opens the door for a test of the previous forth wave and the .382 retracement level. Let's see what develops.

Best of Trading


Wednesday, June 1, 2011

The Market Pulse


The wave count remains problematic as the decline from w.3 was in three waves. Subsequent price action was another three wave rally to new highs,  five overlapping waves to the downside, and a three wave rally that ended at 1347.75.  Given the depth of the decline today, I am beginning to favor the expanded flat interpretation yet the running triangle and the possibility that a top is in are still viable counts. As a reminder, I will not be discussing each interpretation until price action tells me to favor a particular count. At the daily chart level, notice that w.ii circle terminated right at the .618 retracement and within the previous fourth wave.

I'm now able to sketch out the direction, subdivisions and levels for w.4 in it's entirety. Moving forward, I'll be using this as my analog to guide. My next significant target under this scenario is where w.iii circle  =1.618 w. i circle at 1232.5.


Here is the same chart showing what I'll be looking for to confirm that third wave price action is underway.... that is a decisive close below the lower boundary of the channel line (see red bar).


At the 120 min chart level, the first wave of w. iii circle down has reached w. (iii) and I am anticipating that w.(iv) is underway that should complete either in the ON session or tomorrow at 1324. Also note that the previous forth wave terminated at 1326.50. Thereafter another round of selling should draw prices lower. Since labeling the initial subdivisions of an extended wave is difficult it's hard to know with certainty which wave extended and that the labeling I've provided is correct. What we do know is that the steepest part of the decline is the third wave. Should my labeling be correct, as an interim target look for 1300-1303 to provide support. As soon as more price bars can confirm the count, I'll update the intraday chart.


Best of Trading

Chart of the Day: Has Crude Oil Topped ?

Things are about to get ugly.... this
Elliott Wave Pattern is flashing "SELL " ...


At the weekly chart level, w.c circle has extended just beyond where w.c = w.a at 108.975 to complete cycle  w.b. The next move should be down hard. Certainly the first bar down is cause for alarm to a bullish stance. As price has somewhat recovered, on 5/23/2011, Goldman Sachs Reverses Course, Now Says to Buy Crude Oil! This is in my opinion an attempt to place a floor under this market however, the daily chart clearly shows why they may be wrong.


At the daily chart level, the market made a five wave decline to complete w.(1) and is now working a corrective move. Upon a closer inspection of the wave structure, the corrective pattern is that of a flat where w.B retraced more than .9 w.A. The subsequent w.C rally most commonly terminates where w.C =w.A at 105.025 with the 50% retracement in agreement at 104.7


There are other upside targets. Notice that I have added the 1.236 and 1.382 RF of w.B where w.C = 106.95-108.375. This level are also in agreement with the .618 of 107.075 and represent the upper boundary for any flat interpretation. Prints above 108.375 would invalidate the corrective count.

Given the wave pattern and two levels of agreement, there is a high probability that Crude Oil will fail and make new lows.  

I hope you found this information helpful and best of trading.