Thursday, April 28, 2011

Gold: Update


Gold has reached 1530 mark that I had called for, where w.5 =w.1. The wave structure looks incomplete and may subdivide to where w. 5 = .618 {w.1-w.3}.


At the daily chart level, w.(iv) terminated just above the .382 retracement of w.(iii) and the final wave up is underway. I'll be watching this market closely at the intraday level in hopes of identifying the final subdivisions and a market turn.

I hope you found this update helpful and ....

Best of Trading


Wednesday, April 27, 2011

The Market Pulse


The S&P Index rally remains intact as Helicopter Ben didn't disappoint. Even though a new recovery high was reached, the move was anticipated by the corrective RSI signature I spoke of in my 4/20/2011 daily commentary

RSI has pushed through 60, the area where bear rallies end. ROC has also crossed the zero line, another bullish signature. 


Here is the updated weekly chart ... the bullish count. Today, 1346.25 stubbornly gave way leaving other potential targets in play.  Keep in mind that any meaningful advance above 1381 negates the bearish view where w.4 would still unfold in a running triangle (not shown).

For tomorrow, price has limited upside potential as the upper Trendline of the Detrend Osc. should provide resistance.


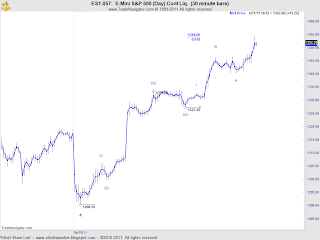
Turning our attention to the 30 minute chart level, the subdivisions of w.5 are unfolding. By the close, price had met a logical price objective were w.(v) of w.5 = .618{w.(i)-(iii)} yet the final subdivisions appear to need one more push up to complete the count.

Let's see what develops tomorrow.

Best of Trading


Tuesday, April 26, 2011

Chart of The Day: Three Reasons Why Copper Is Heading Lower

I can find three compelling reasons why Copper is rolling over. Is the Copper bull market over or just about to provide investors with another entry ? To find out, watch this brief video.


Monday, April 25, 2011

The Market Pulse

Today's session in the ES_F was a snorer at best. With the FED decision regarding interest rates due on Wednesday, participation will most likely remain on the lighter side. Materially, nothing has changed from the short term forecast provided within the April 24, 2011 edition of Heard On The Street. Therefore, I thought I would spend some time on Gold.


At the weekly chart level, Gold's rally is very mature with 1530 as a target for the termination of w.5.


At the daily chart level, w.(i) - w.(iii) of w.(v) of w.5 are complete and I'm calling for a modest decline to where w.(iv) =.382w.(iii) at 1491 before making a final push to 1530.


Best of Trading

Sunday, April 24, 2011

Heard On The Street

The S&P has rallied off the 4/18/2011 low but is the market really heading significantly higher or is danger lurking? Learn more by viewing this weeks video edition of Heard On the Street .


Best of Trading

Thursday, April 21, 2011

$ES_F : An Intraday Perspective

Wave patterns that start in three waves often spell trouble as there are a number of possible outcomes. Often an analyst will not be able to clearly identify the wave pattern until the pattern has completed!

In last night's blog post, I stated that I am unable to make a high probability forecast. Nothing has changed as the market appeared to be on a verge of following though, but a negative Philly Fed report coupled with a shortened trading week has at least temporarily beaten back the bulls. 


The chart attached is purposely marked without subdivision wave labels as of w.3. Each diamond represents a three wave pattern. If 1335.75 isn't taken out, then the possibility exists that price may rotate back into the previous range in 3 wave setting up a triangle w.4.

Note: I have also noticed that certain commodities exhibit a similar pattern. Sticking with the all-in-one theme of markets rising / falling together based upon the USD movement, there is a possibility that commodities are projecting the next move for equities as they appear to be slightly ahead in terms of pattern development. 

Should 1335.75 be taken out to the upside, then the wave structure will be limited to a few counts.Look for me to expand on the commodity theme and updated wave counts for the emini's during this weeks edition of "Heard On The Street".

Best of Trading

Wednesday, April 20, 2011

The Market Pulse

Today the market gaped up at the open after a very strong ON session, then spent most of the remainder of the session consolidating, yet by 4:15 pm est. the market bolted higher on earnings announcements.


Previously I left readers with the bearish pair of 1-2's and a bullish count. At today's open, price pushed above critical resistance of 1319.25 and negated the 1-2 pair leaving the bullish continuation count with w.4 still unfolding. To review those charts click here.


Unfortunately, the fact that the market has retraced a significant portion of the decline from 1335.75 to 1290.25 also places this wave count in jeopardy. At the time of this writing, price is already challenging 1335.75.


As I have mentioned in the  4/18/11 post, since w.2 was a sideways correction, w.4 MUST be a sharp correction to adhere to the rules of alternation. At this point, I can label the structure beginning at w.3 in a number of ways. Until the number of possibilities are narrowed to a select few, I am unable to make a high probability forecast.


What I am relatively sure of are the clues that technical pages provide. Note the vertical line that corresponds with a RSI reading that held 40. This is a signature of a corrective price structure. Also note that the ROC made a minimum break of the zero line another signature of a corrective phase.  Today's move pushed RSI just shy of 60. Bear rallies usually contained within a 60 reading of RSI. If RSI pushes beyond 60, odds are that w.4 ended at 1243.25 and w.iii of w.5 was underway.

As soon as I am able to identify a high probability count, I'll update everyone. Until then....

Best of Trading

Monday, April 18, 2011

The Market Pulse


Well... that was a surprise. The S&P reaffirmed the US credit rating but rated it's debt  as negative. The market was already trading lower at the time but this news certainly accelerated the move.


The chart above shows the possible wave labeling based upon today's trade. It fits well  within the context of the analysis made in my weekly edition of Heard On The Street .

As constructive as today was to the downside, by the end of the day, the market rotated back into the territory of w.i circle... creating possible pair of 1-2's. This implies selling pressure greater than today's action for tomorrows trade. There can be no mistake about it as price should decline on massive volume and thrusting in nature.
Anything less and the wave personality doesn't fit price action and the count is suspect.


However, I might be ahead of myself here. While the wave labeling in the previous chart meets the requirements for a completed corrective wave, the time relationships is a bit short. Normally, most corrections of a previous price structure occurs in a minimum of  a .382 time relationship. From the chart, you can see that the termination point of w.(ii) of 1303.75 is well shy of this relationship and therefore implies that w.(ii) is still unfolding. If so the current wave labeling would be called into question. Possibly what we are witnessing is an indication of just how weak the market is and justifies the third wave extension. We'll see tomorrow.

Best of Trading


Sunday, April 17, 2011

Heard on The Street

Catch up on where the S&P, Gold and Crude Oil are heading in this weeks video addition of Heard on the Street.

Thursday, April 14, 2011

ES_F: Alert


The following chart is an alternate view of today's early action. It is also an alternative that was not discussed in last nights update. When using EW, there are always several counts that are viable during the middle portions of wave structures. Anticipating them and having an open mind, rather than being locked into a count is critical to our success as traders. Should the market hold support and rally above 1304.75 then close the gap, then this this interpretation will most likely be adopted.

Best of Trading

Wednesday, April 13, 2011

The Market Pulse


Previously I left readers with bullish and bearish wave counts. The above chart has been eliminated as the 1305 low was reached beyond the maximum extensions for corrective patterns. Secondly, the ensuing price action is corrective rather than impulsive.

Therefore, the following chart(s)... contain scenarios for tomorrows session.


The preferred count has w.(i) complete where w.(ii) is unfolding in a sharp zig-zag correction that should terminate at 1320.5 to 1324. This interpretation is invalidated with a print below critical support or 1305.

Other alternates include:


Under this alternative, w.(ii) ended and prices should decline from the onset of tomorrow's open as w.(iii) down draws price significantly lower. Watch the ON session for hints that this interpretation was unfolding. As before, the interpretation is invalidated with a print above critical resistance or 1317.50.


The final alternative also has prices moving to the upside tomorrow as w.(ii) is an expanded flat correction, although not perfect in form, that should terminate between the heavy resistance levels surrounding 1320.5-1324. Once again, as in each scenario, this interpretation is invalidated with a print below critical support or 1305.

In summary, a break of 1305 opens the down to significantly lower prices while a rally to 1320.5-1324 only postpones the fact that the direction of the market is clearly down at this point.

Monday, April 11, 2011

The Market Pulse

Announcements

I'd like to thank everyone for their patience as I spend the weekend re-installing my computer's operating system and couldn't produce the weekly edition of Heard On The Street. In an attempt to catch up, tonight's update will contain the charts of other markets as well as the S&P but will not contain much of commentary.

S&P


BULLISH


The previous three charts show the bullish scenario and termination point of w.(C) at 1346.25 or 1381.5 or at the .786 retracement of 1389.75. At the 60 min chart level, w.iv circle is unfolding in a double three with Fibonacci support surrounding 1314.25-1314.


BEARISH


OIL


Oil has completed w.(3) and w.(4) should unfold as a sharp correction according to the principle of alternation, i.e. as w.(2) was sideways expanded flat. The market should should find support at the .236 or .382 retracement of w.(3).... the most common of .382 that also corresponds to the previous fourth wave of one lesser degree.


GOLD


Best of Trading


Thursday, April 7, 2011

ES_F: Alert


Here's the updated chart. Notice that the pattern resolved within 1 bar of the anticipated retracement of w.v circle. If you missed last nights post that covered this scenario, you can read more at : http://elliottwavelive.blogspot.com/2011/04/market-pulse_06.html

One caveat... the sudden drop MUST confirm i.e. by making a five wave decline or the larger implied decline (w.3 circle) is flawed.

Let's watch the show.


Best of Trading

NOTE: I will be unavailable and offline from 12 pm est. for the remainder of the day session.

Wednesday, April 6, 2011

The Market Pulse

The ES_F opened with a furry but the gap was quickly closed, then the market spend the remainder of the session in range bound trading.There are essentially two scenarios: a fourth wave triangle or an ending diagonal. Regardless of which interpretation prevails, tomorrows session will quickly expose which pattern is correct.


The ending diagonal implies that the top completed at today's open. While I don't have the structure labeled, the decline from 1335.75 could be counted as a five wave decline, followed by a three wave countertrend move.


A challenge of w.iv circle (1324.25) within 50% of the time the pattern took to form would bolster this view. W.v circle took 46 bars. The 50% time relationship implies that the w.v circle will be retraced within 69 bars(start to finish). 50% of 46 is 23 bars. Since 20 bars are already present, 3 price bars remain.... so w.v should be retraced by 10:30 am EST. As with any time relationship, it's not an exact science so I would give the relationship some leeway. 


The second scenario is a fourth wave triangle where the pattern is not complete but should resolve to the upside tomorrow after a small decline to complete w.(e) either in the ON session or early on in the day session.

As soon as I can determine which scenario is correct I will update readers with either upside or downside targets.


Best of Trading


Monday, April 4, 2011

The Market Pulse


Today was certainly quiet as the ES_F was net sideways. As I mentioned in my weekly edition of Heard On The Street for 4.3.11, the intraday internal structure looked like w.iv circle was unfolding. Today, continues that thought process as the structure counts incomplete and has yet to reach the .236 or .382 retracement levels.


Quite possibly a complex pattern will develop to reach those levels, however while the market put most to sleep, I noticed that today was an inside day that are often followed by volatile sessions. So tomorrow may set up as a trend day. With the current elliott wave count calling the market lower odds favor the downside.

Let's hope tomorrow will be a great trading day.

Best of Trading

Sunday, April 3, 2011

Heard On The Street

In this weeks video edition of Heard On The Street, I'll be reviewing the monthly and daily charts of ES_F and $SPX as well as revisiting the chart of the Gold/Oil Ratio.

Enjoy.