Showing posts with label Triangle. Show all posts

Friday, February 8, 2013

Chart of Day : Copper - $JJC


Triangle Breakout or Failure?


I've been tracking this ETF of Copper, ticker symbol JJC for quite some time. My anticipation of a w.B circle triangle formation and subsequent breakout is long overdue. 

While a breakout may have occurred on less than impressive volume, price is either retesting the upper boundary or the pattern is going to fail.  A failure would make sense here as breakouts nearer the apex of the triangle are typically weaker than one that breaks out at the 1/2 way point on heavy volume. 

Should price test and hold support at the upper boundary, the current price action from w.(E) low looks to be in threes or an ending diagonal. 


Turning your attention to Copper futures, we see that the proposed pattern and breakout  is yet to occur leading me to suggest that both the ETF and futures have more back and filling to do before a true breakout event occurs. 

At this juncture, breaks below 340.3 (Copper futures) and  43.17 (ETF) respectively would negate the triangle interpretations. 


Let's see what unfolds. 


Best of Trading

======================================================================
ElliottwaveLive is not an investment advisory service or broker dealer. None of its contributors are registered investment advisors, licensed stock brokers or CTA's. The author may hold short term and long term positions in the futures, stocks and ETF's discussed herein. The author may also trade around those positions which may be in direct conflict with your positions. Complete trade disclosures of the contributor’s holdings are posted at www.elliottwavelive.blogspot.com. See Trader Disclosure. 

Trade at your own risk. The blog site, Newsletter and all other information, material and content accessible from this Site (collectively, the "Content")  provided herein provides the context for market analysis with respect to a market's, a security or a commodity's general position utilizing the Elliott Wave Principle. The Content contained herein are the opinion and general comments of the author and is based upon information that Mr. Sinibaldi considers reliable but neither ElliottWaveLive nor he warrants it's completeness or accuracy and it should not be relied upon as such. Mr. Sinibaldi or ElliottWaveLive (collectively, referred to as “EWL”) are not under any obligation to update or correct any content provided on this website. Any statements and or opinions are subject to change without notice. The content and comments contained herein neither purports nor intends to be, specific trading advice. It has been prepared without regard to any particular person's investment objectives, financial situation and particular needs. Information should not be considered as an offer or enticement to buy, sell or trade. 

A more and comprehensive Risk Disclaimer and Disclosure Statements is available within the left margin of this blogsite.   
======================================================================

Fair Disclosure Notice: I do not have a position in any of the aforementioned futures markets or securities related to this article. 

Thursday, September 6, 2012

ES Update: How I'm playing it!

Technicals Point To Another High 


At the weekly chart level (not shown) my technical indicators point to another recovery high. As such, I'm looking for a way to marry the short term 60 minute chart pattern with the larger degree trend. 


The initial decline was easy to identify as a three wave corrective zig-zag pattern. 

Note: I have highlighted the current price action from the termination point of the zig-zag. We will be evaluating that region.

Building The Trade Plan 

According to the Elliott Wave Principle, corrective patterns that begin in three, have the following corrective patterns associated with them:

1. 3-3-5 Flat - Under this pattern the second part of the pattern will be another three wave structure. The possibilities are another zig-zag, a flat or a triangle. 

Right of the bat, I see the market is sideways and any sharp (zig-zag) can be eliminated. Secondly, a flat would retrace most of the initial decline... which it doesn't. 

That leaves us with a triangle in the w.b position!


The following chart illustrated the triangle interpretation. Under this scenario, I'm looking for the market reaction to the jobs report and ECB to be muted. As enthusiasm wanes, the market will drift lower in w.(d).


2. 3-3-3-3-3 Triangle - You will find that this pattern is very similar in nature with respect to the middle part of the pattern but the resolution is to the upside. 


Each scenario promises more sideways price action, therefore that's my clue that my interpretations are correct. 


Solving the Directional Issue

Since there is no way to be certain of the direction of the thrust that accompanies these (2) triangular patterns, I am taking a conservative approach and playing the breakout once the respective (d) waves are exceeded.  


Let's see what develops


Best of Trading

======================================================================
ElliottwaveLive is not an investment advisory service or broker dealer. None of its contributors are registered investment advisors, licensed stock brokers or CTA's. The author may hold short term and long term positions in the futures, stocks and ETF's discussed herein. The author may also trade around those positions which may be in direct conflict with your positions. Complete trade disclosures of the contributor’s holdings are posted at www.elliottwavelive.blogspot.com. See Trader Disclosure. 

Trade at your own risk. The blog site, Newsletter and all other information, material and content accessible from this Site (collectively, the "Content")  provided herein provides the context for market analysis with respect to a market's, a security or a commodity's general position utilizing the Elliott Wave Principle. The Content contained herein are the opinion and general comments of the author and is based upon information that Mr. Sinibaldi considers reliable but neither ElliottWaveLive nor he warrants it's completeness or accuracy and it should not be relied upon as such. Mr. Sinibaldi or ElliottWaveLive (collectively, referred to as “EWL”) are not under any obligation to update or correct any content provided on this website. Any statements and or opinions are subject to change without notice. The content and comments contained herein neither purports nor intends to be, specific trading advice. It has been prepared without regard to any particular person's investment objectives, financial situation and particular needs. Information should not be considered as an offer or enticement to buy, sell or trade. 

A more and comprehensive Risk Disclaimer and Disclosure Statements is available within the left margin of this blog site.   


======================================================================
Fair Disclosure Notice: I do not have a position in any of the aforementioned futures markets or securities related to this article. 


Tuesday, August 7, 2012

Soybeans Lower?

I thought I would expand a bit upon a tweet I made on August 3, 2012, where I said, " Any way u cut the fish,  going lower. Any temp. strength will be negated."


The basis for my opinion was due to the fact that the wave structure from 7/24 - 7/31 appeared to be in three waves and thus a corrective rally. If my assessment was correct then a significant decline could ensure and thus the "context" for my comment after the 8/2/2102 close. 

Note: that temporary strength was indeed negated and yesterday price turned south

From the 1656 high, the decline should unfold in a five wave decline. The pattern would be confirmed on a closing bases below 1552^2. If not, the possibility remains that we will see a complex corrective pattern developing from 1690... possibly a triangle that would eventually reach a new recovery high.

I hope you found this information helpful and...

Best of Trading 

======================================================================
ElliottwaveLive is not an investment advisory service or broker dealer. None of its contributors are registered investment advisors, licensed stock brokers or CTA's. The author may hold short term and long term positions in the futures, stocks and ETF's discussed herein. The author may also trade around those positions which may be in direct conflict with your positions. Complete trade disclosures of the contributor’s holdings are posted at www.elliottwavelive.blogspot.com. See Trader Disclosure. 

Trade at your own risk. The blog site, Newsletter and all other information, material and content accessible from this Site (collectively, the "Content")  provided herein provides the context for market analysis with respect to a market's, a security or a commodity's general position utilizing the Elliott Wave Principle. The Content contained herein are the opinion and general comments of the author and is based upon information that Mr. Sinibaldi considers reliable but neither ElliottWaveLive nor he warrants it's completeness or accuracy and it should not be relied upon as such. Mr. Sinibaldi or ElliottWaveLive (collectively, referred to as “EWL”) are not under any obligation to update or correct any content provided on this website. Any statements and or opinions are subject to change without notice. The content and comments contained herein neither purports nor intends to be, specific trading advice. It has been prepared without regard to any particular person's investment objectives, financial situation and particular needs. Information should not be considered as an offer or enticement to buy, sell or trade. 

A more and comprehensive Risk Disclaimer and Disclosure Statements is available within the left margin of this blog site.   


Friday, August 3, 2012

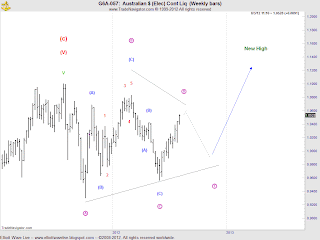
Using Wave Patterns In Isolation: Aussie Dollar


All too often I see  traders struggle with longer term wave patterns. Their desire to correctly label the chart often leads to one's inability to be nimble. 

The weekly chart of the Aussie Dollar shows a triangular wave pattern. All an elliottician needs to know is that  price should remain in a sideways fashion until the pattern resolves. Since, triangles can only be found in w.4 and w.B or w.e of a triangle, labeling the adjacent waves becomes irrelevant (except under 3 below) and we know that price will make a final thrust move to new highs in this case.

This frees up a trader's mind and allows one to trade the pattern! 

Since triangles are present right before a terminal move, traders have the following options when day trading triangles:

  1. Trade the three wave swing of w.b, w.c, w.d, w.e.
  2. Wait until w.e concludes and go long.
  3. Reverse after the trust out of the triangle reaches it's termination point.

Of course, you must follow your individual trade plan for entry. The wave principle is only a guide to market position and an anticipated market direction.  

In conclusion, I find that KISS (keeping it simple stupid) applies best to using elliott wave in isolation.  I've been wrong many times as to the duration of the move, but getting the initial direction correct improves the probability of a successful money making trade. 

I hope you found this lesson helpful and ...

Best of Trading


======================================================================
ElliottwaveLive is not an investment advisory service or broker dealer. None of its contributors are registered investment advisors, licensed stock brokers or CTA's. The author may hold short term and long term positions in the futures, stocks and ETF's discussed herein. The author may also trade around those positions which may be in direct conflict with your positions. Complete trade disclosures of the contributor’s holdings are posted at www.elliottwavelive.blogspot.com. See Trader Disclosure. 

Trade at your own risk. The blog site, Newsletter and all other information, material and content accessible from this Site (collectively, the "Content")  provided herein provides the context for market analysis with respect to a market's, a security or a commodity's general position utilizing the Elliott Wave Principle. The Content contained herein are the opinion and general comments of the author and is based upon information that Mr. Sinibaldi considers reliable but neither ElliottWaveLive nor he warrants it's completeness or accuracy and it should not be relied upon as such. Mr. Sinibaldi or ElliottWaveLive (collectively, referred to as “EWL”) are not under any obligation to update or correct any content provided on this website. Any statements and or opinions are subject to change without notice. The content and comments contained herein neither purports nor intends to be, specific trading advice. It has been prepared without regard to any particular person's investment objectives, financial situation and particular needs. Information should not be considered as an offer or enticement to buy, sell or trade. 

A more and comprehensive Risk Disclaimer and Disclosure Statements is available within the left margin of this blog site.   


Wednesday, December 14, 2011

Chart of the Day: First Solar - Chart patterns and fundamentals


First Solar cut its 2011 sales and earnings forecast for the second time in two months and forecast 2012 profits below Wall Street's view, sending its shares tumbling 20 percent in premarket trading... yet for months the chart forewarned that lower prices were forthcoming. The consolidation  that began in 11/2008 (w.a) through 6/2011 (w.b) best fits a triangular pattern that occurs prior to the final wave in a wave sequence. As such, triangles can be found in waves B, X or wave 4 positions.

An elliotician would not have gotten too excited on 12/7/2011 when the company reported that they sold specific assets to Berkshire Hathaway. The stock spiked $5.78  ( refer to a daily price chart, not shown) before closing up a meager $1.88. I do know what Warren Buffet's strategy is for solar assets but judging from this chart, there may be more risk to the downside for this company and the industry as a whole before making a meaningful low.

Best of Trading

Tuesday, August 2, 2011

The Market Pluse: An Interim Report


With two trading days in the books, heavy selling pressure has finally eliminated the alternate bullish running triangle interpretation for the Emini SP. The key area of critical support (1252.25) has been decisively broken leaving only bearish interpretations.

While today's close was fulfilling , in that the 2007-2011 analogy continues to provide a road map for anticipating where the market is headed, I would be remiss to inform readers that post pattern behavior is really important. The following chart is one of the two bearish interpretations. Where w.e actually ended is not locked in as of yet but it's really not required for the discussion below. What is, is the break of the lower boundary line and w.d.  


What I mean by post pattern behavior is that price has just broken out of a triangle and subsequent price action should confirm the pattern i.e. prices should swiftly decline in a thrusting manner with a minimum measured move in length equal to the widest length of the triangle (w.A). That would imply 1219.25 yet further potential exists to 1166.75 if you're viewing the pattern as a classical H&S. Should price action not react as the pattern implies, then something may be wrong with the analysis or the count itself.

Keep in mind that trading is like playing pool. If you've ever watch great pool players, they set up the table for their next shot. That's what we're doing now. First confirming that the analysis is right, then aligning with the trend.  In the coming days we'll eventually see a counter trend move that should be a great set up to ride the trend in the largest move down.

Tomorrow we have the jobs report. Given the dreadful economic news of late, a bad report could cause more technical damage to the market. We'll see what happens.

Best of Trading


Friday, May 6, 2011

Chart of the Day: EUR-USD


The EUR-USD has completed a trend sequence that began on 1/10/11... w.(B). Price action over the early part of May appears to unfolded in an expanding diagonal. This would explain the swift decline as price action of waves that follows a diagonal quickly retraces back to the origin of where the pattern began or 1.4157.


Dropping down to the intraday chart level, the structure of the expanding diagonal can be clearly seen.  The decline from 1.4936 counts well as an impulsive wave where w.(iii) is complete and w.(iv) appears to be unfolding in a triangle or possibly an expanded flat that adheres to the rules of alternation due to the fact that w.(ii) was a sharp corrective move. For today, look sideways or up to a maximum of 1.4617 for w.(iv). Thereafter another round of selling should draw prices to the 1.4157 target to complete w.i circle.

I hope you found this information helpful and...

Best of Trading

Wednesday, April 6, 2011

The Market Pulse

The ES_F opened with a furry but the gap was quickly closed, then the market spend the remainder of the session in range bound trading.There are essentially two scenarios: a fourth wave triangle or an ending diagonal. Regardless of which interpretation prevails, tomorrows session will quickly expose which pattern is correct.


The ending diagonal implies that the top completed at today's open. While I don't have the structure labeled, the decline from 1335.75 could be counted as a five wave decline, followed by a three wave countertrend move.


A challenge of w.iv circle (1324.25) within 50% of the time the pattern took to form would bolster this view. W.v circle took 46 bars. The 50% time relationship implies that the w.v circle will be retraced within 69 bars(start to finish). 50% of 46 is 23 bars. Since 20 bars are already present, 3 price bars remain.... so w.v should be retraced by 10:30 am EST. As with any time relationship, it's not an exact science so I would give the relationship some leeway. 


The second scenario is a fourth wave triangle where the pattern is not complete but should resolve to the upside tomorrow after a small decline to complete w.(e) either in the ON session or early on in the day session.

As soon as I can determine which scenario is correct I will update readers with either upside or downside targets.


Best of Trading


Wednesday, March 16, 2011

Before The Bell


The ON session has produced the bounce that I was expecting but the market was unable to push through to my 1298 target as overhead resistance of 1283.50 held the advance in check.

For today, the advance from the 1251 low, continues to look like a corrective wave pattern that is currently working a triangle w.b circle. Prices should chop around sideways before eventually breaking the upside boundary of the trendline, with a minimal target of 1286 but most likely a retest of the previous w.4 at 1303.75 is in order.

The loss of w.(c) and w.(a) would most likely mean that a more complex w.b cirlce was unfolding before an eventual rally to complete the corrective structure. As soon as the w.b circle is complete, I will update readers with more defined upside targets.

I hope you found this information helpful ...

Best of Trading