Showing posts with label Ending Diagonal. Show all posts

Friday, February 8, 2013

Chart of Day : Copper - $JJC


Triangle Breakout or Failure?


I've been tracking this ETF of Copper, ticker symbol JJC for quite some time. My anticipation of a w.B circle triangle formation and subsequent breakout is long overdue. 

While a breakout may have occurred on less than impressive volume, price is either retesting the upper boundary or the pattern is going to fail.  A failure would make sense here as breakouts nearer the apex of the triangle are typically weaker than one that breaks out at the 1/2 way point on heavy volume. 

Should price test and hold support at the upper boundary, the current price action from w.(E) low looks to be in threes or an ending diagonal. 


Turning your attention to Copper futures, we see that the proposed pattern and breakout  is yet to occur leading me to suggest that both the ETF and futures have more back and filling to do before a true breakout event occurs. 

At this juncture, breaks below 340.3 (Copper futures) and  43.17 (ETF) respectively would negate the triangle interpretations. 


Let's see what unfolds. 


Best of Trading

======================================================================
ElliottwaveLive is not an investment advisory service or broker dealer. None of its contributors are registered investment advisors, licensed stock brokers or CTA's. The author may hold short term and long term positions in the futures, stocks and ETF's discussed herein. The author may also trade around those positions which may be in direct conflict with your positions. Complete trade disclosures of the contributor’s holdings are posted at www.elliottwavelive.blogspot.com. See Trader Disclosure. 

Trade at your own risk. The blog site, Newsletter and all other information, material and content accessible from this Site (collectively, the "Content")  provided herein provides the context for market analysis with respect to a market's, a security or a commodity's general position utilizing the Elliott Wave Principle. The Content contained herein are the opinion and general comments of the author and is based upon information that Mr. Sinibaldi considers reliable but neither ElliottWaveLive nor he warrants it's completeness or accuracy and it should not be relied upon as such. Mr. Sinibaldi or ElliottWaveLive (collectively, referred to as “EWL”) are not under any obligation to update or correct any content provided on this website. Any statements and or opinions are subject to change without notice. The content and comments contained herein neither purports nor intends to be, specific trading advice. It has been prepared without regard to any particular person's investment objectives, financial situation and particular needs. Information should not be considered as an offer or enticement to buy, sell or trade. 

A more and comprehensive Risk Disclaimer and Disclosure Statements is available within the left margin of this blogsite.   
======================================================================

Fair Disclosure Notice: I do not have a position in any of the aforementioned futures markets or securities related to this article. 

Sunday, November 4, 2012

Exxon Mobil : Room To Run?


Ending diagonals are one of my favorite patterns. They are discernible and a high probability trading pattern.

Exxon Mobil, ticker symbol XOM ,  has been in a strong uptrend since December 1987. As I reviewed the quarterly chart, a terminal ending diagonal caught my eye. I need to know nothing else about where to label the substructure of the larger trend. Why? Because ending diagonal primarily in the fifth wave position. A small percentage occur as the final wave in a corrective wave C. Regardless they are found at terminal points of larger patterns. When complete, price tend to retrace to the origin of the pattern in 1/2 to 1/3 the amount of time it took to create the structure.

Looking forward, Exxon has room to run after completing it's w.4 in a three wave decline. Thereafter, price should make new recovery highs in three waves ( diagonals have 3-3-3-3-3 internal subdivides).

Learning to train your eyes to see these patterns takes time and practice. As an exercise, spend some time looking at the S&P 500 at multiple degrees of trend. Not only will you get a feel for the broader market's health, but you'll also discover many trading opportunities. That's how I discovered this pattern. You will too.

I hope you found this helpful and ....


Best of Trading

======================================================================
ElliottwaveLive is not an investment advisory service or broker dealer. None of its contributors are registered investment advisors, licensed stock brokers or CTA's. The author may hold short term and long term positions in the futures, stocks and ETF's discussed herein. The author may also trade around those positions which may be in direct conflict with your positions. Complete trade disclosures of the contributor’s holdings are posted at www.elliottwavelive.blogspot.com. See Trader Disclosure. 

Trade at your own risk. The blog site, Newsletter and all other information, material and content accessible from this Site (collectively, the "Content")  provided herein provides the context for market analysis with respect to a market's, a security or a commodity's general position utilizing the Elliott Wave Principle. The Content contained herein are the opinion and general comments of the author and is based upon information that Mr. Sinibaldi considers reliable but neither ElliottWaveLive nor he warrants it's completeness or accuracy and it should not be relied upon as such. Mr. Sinibaldi or ElliottWaveLive (collectively, referred to as “EWL”) are not under any obligation to update or correct any content provided on this website. Any statements and or opinions are subject to change without notice. The content and comments contained herein neither purports nor intends to be, specific trading advice. It has been prepared without regard to any particular person's investment objectives, financial situation and particular needs. Information should not be considered as an offer or enticement to buy, sell or trade. 

A more and comprehensive Risk Disclaimer and Disclosure Statements is available within the left margin of this blogsite.   
======================================================================

Fair Disclosure Notice: I do not have a position in any of the aforementioned futures markets or securities related to this article.


Monday, August 27, 2012

Will Another Leader Fall?


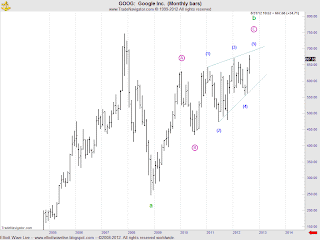
Google (ticker GOOG) has been tracking a bearish ending diagonal within an A-B-C correction that should resolve with a swift move to the downside. Price has made a recovery high that looks incomplete BUT the level is interesting as w. C circle = .618 w.A circle. A decline below 556.52 before any further recovery high would, at a minimum, confirm that rally from w.B circle was complete.

At the larger cycle degree, the wave interpretation would imply an eventual decline to below w.a. 

Best of Trading


======================================================================

ElliottwaveLive is not an investment advisory service or broker dealer. None of its contributors are registered investment advisors, licensed stock brokers or CTA's. The author may hold short term and long term positions in the futures, stocks and ETF's discussed herein. The author may also trade around those positions which may be in direct conflict with your positions. Complete trade disclosures of the contributor’s holdings are posted at www.elliottwavelive.blogspot.com. See Trader Disclosure. 

Trade at your own risk. The blog site, Newsletter and all other information, material and content accessible from this Site (collectively, the "Content")  provided herein provides the context for market analysis with respect to a market's, a security or a commodity's general position utilizing the Elliott Wave Principle. The Content contained herein are the opinion and general comments of the author and is based upon information that Mr. Sinibaldi considers reliable but neither ElliottWaveLive nor he warrants it's completeness or accuracy and it should not be relied upon as such. Mr. Sinibaldi or ElliottWaveLive (collectively, referred to as “EWL”) are not under any obligation to update or correct any content provided on this website. Any statements and or opinions are subject to change without notice. The content and comments contained herein neither purports nor intends to be, specific trading advice. It has been prepared without regard to any particular person's investment objectives, financial situation and particular needs. Information should not be considered as an offer or enticement to buy, sell or trade. 

A more and comprehensive Risk Disclaimer and Disclosure Statements is available within the left margin of this blog site.   

Friday, August 3, 2012

ES_F Update:


I wanted to drop a quick not to readers regarding the pattern that has developed over the past few days in the eminis. Patterns that are difficult to identify typically are corrective but with all the recent volatility, including yesterdays move, I wanted to present an ending diagonal scenario that I am looking at. Notice that the key area of 1397.5 continues to stay in focus.... where w.c = w.a  to complete w.2 red. Breaks of w.(iv) low would negate this scenario and send me back to the drawing board.

Be careful out there today. 

If you have been following along, my previous comments can be reviewed here at:

Elliott Wave Live: ES_F Update:


Best of Trading

======================================================================
ElliottwaveLive is not an investment advisory service or broker dealer. None of its contributors are registered investment advisors, licensed stock brokers or CTA's. The author may hold short term and long term positions in the futures, stocks and ETF's discussed herein. The author may also trade around those positions which may be in direct conflict with your positions. Complete trade disclosures of the contributor’s holdings are posted at www.elliottwavelive.blogspot.com. See Trader Disclosure. 

Trade at your own risk. The blog site, Newsletter and all other information, material and content accessible from this Site (collectively, the "Content")  provided herein provides the context for market analysis with respect to a market's, a security or a commodity's general position utilizing the Elliott Wave Principle. The Content contained herein are the opinion and general comments of the author and is based upon information that Mr. Sinibaldi considers reliable but neither ElliottWaveLive nor he warrants it's completeness or accuracy and it should not be relied upon as such. Mr. Sinibaldi or ElliottWaveLive (collectively, referred to as “EWL”) are not under any obligation to update or correct any content provided on this website. Any statements and or opinions are subject to change without notice. The content and comments contained herein neither purports nor intends to be, specific trading advice. It has been prepared without regard to any particular person's investment objectives, financial situation and particular needs. Information should not be considered as an offer or enticement to buy, sell or trade. 

A more and comprehensive Risk Disclaimer and Disclosure Statements is available within the left margin of this blog site.   


Tuesday, June 5, 2012

My S&P Trade Plan

The market spent much of the remaining hour using up allot of buying power to achieve a measly 2.5 gain at the 15 minute chart level (not shown). I could easily make a case that I have 5 waves up and done at the close. This, along with harmonic corrective moves (see chart below) and waning momentum (not shown) has me on alert for a reversal. However as you will see in my trade plan for tomorrow, being cautious is prudent. 


THE TRADE PLAN


Above is my preferred count. If correct, I'm looking for another down up sequence to complete the ending diagonal pattern. There is massive resistance between 1289-91as well as the following reverse fib levels as measured from w.(b) to w.(a) [see chart below].


Above is another 60 min. chart of the emini that shows the opening print as of 10:00 est. I often find that the first 1 1/2 hours of trade ends with a smooth transitions to the previous close. I've placed the same resistance levels on the chart but if you look closely 1289.75 is my w.iii low. So this provides structural resistance as well. 

So the stage is set. If the market obliges, then I'm looking to go short. Should the market complete the pattern in the ON session or if a top is already in as stated above, then I'm looking to short against the highs as long as I can count a five wave decline.

Let's see what happens.

Best of Trading


Tuesday, October 4, 2011

ES_F : Flash Alert


Today's trade reached my 1165-66 lower price target, yet the waves don't count well. The above chart is provided in response to a tweet that I made. I said, "Readers who may be utilizing an ending diagonal would be accepting a less than textbook pattern". If you calculate the waves as labeled, each successive three wave decline from the w.4 high is greater than the prior. Therefore, I would assign a very low probability to it from an academic level.

While I have not had an opportunity to review all the intraday charts at this juncture I wanted to share what I have discovered and what I'm looking for tomorrow.

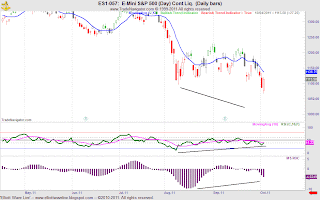
The next series of charts show momentum signatures. Each is self explanitory and implies that the "risk" is now to the downside... meaning the likelyhood for significant further declines are greatly reduced.


Also, note that price tagged 3-Sigma that contains 99.9% of all price movement and has bounced.


Heavy volume came into the market around 3:30 EST, in what I am labeling w.(iii). For the ON session prices should drift lower to either the .236-.382 retracement of w.(iii), followed by another advance to where w.(v) = w.(i). Note that I am not calling a bottom yet. I'm only evaluating the wave structure from today's low. More evidence is required to conclude that the selling that began from1357.25 had ended and that a tradeable low is in place.

Whether the initial five wave advance completes in the ON session remains to be seen.

Let's see what unfolds.

Thursday, September 1, 2011

Before The Bell: Updated $ES_F chart


Last night I left readers with this chart and I'd like to expand upon the subdivisions of w.(v) which at the time didn't count well. Well I slept on it and with a fresh pair of eyes, I decided to look at additional chart levels to gain more confidence in the fact that w.iv circle had ended.

Here's my findings:


At the 360 min. chart level the wave pattern from 1193.5 looked like an ending diagonal which as you know is a terminal pattern. Also note the selling pressure that came in right at my 1227-28 target as shown by the long upper tail of the candle. This bodes well for the previous conclusion that w.iv circle had ended. Yet I wanted to dig deeper... looking at tick charts to get a birds eye view of the subdivisions.


From w.(iv) low, I can count a series of 3's for each subdivision of waves {i-v}
of w.(v). Subsequent price actions counts well, working w.(iii)  but I'd like to see another down sequence to complete w.1 of w.(iii) for the count to remain on track. Of course the market doesn't care what I'd like but it would be great if it would oblige me!

Ultimately 1193.5 needs to be broken for the bears to really get excited.

Let's watch the open.

Best of Trading


Monday, August 15, 2011

The Market Pulse : A Trap Brewing?

Could There Be A Trap Brewing?


I want to expand on my weekend edition of Heard on the Street.... but first if you missed it, just click on the link.

Tonight I would like to review the 2007 swing that we can measure using the 2007-2011 analogy and compare it to the expectations for the termination of the current advance from 1097 and the wave count.

I think you'll find the road-map is crystal clear.


From the weekly chart, the swing from 1262 - 1397.75 was 135 point and a two week (bar), A-B-C zig-zag. Transposing the same measured move, we can estimate that the rally from the current 1097 low still has room to run and could reach 1233. This fits well with my weekend call i.e. the up, down sequence that I'm looking for.


Another key point, is the possible similarities between the 50% retracement levels. If history repeats, the current rally would stall at 1225.

So in comparison , I have established a range of 1225-30 as a termination point.

Also note, that in 2007, price traced a w.b that terminated within the range of the first bar (w.a) of the zig-zag. We should expect the same in 2011.

One last point on today's trade. Even though the analogy is working beautifully, the 10 pt opening gap is a concern, as they are typically found in third waves. It may also signal an exhaustive move (see below). Therefore, while I still have bearish bias, I have set critical resistance at 1252. 25. Any print above this level negates and most likely means that my larger degree wave count is flawed.


Dropping to the intraday chart levels, we now want to look at the internal subdivisions and expansion series to see if they match the 2007-11 analogy script.

First, the current interpretation called for a w.iv = .382 w.iii at 1191 and where w.c = w.a at 1192. Both levels have been exceeded as the count looked incomplete... signaling that the internal subdivisions were still subdividing.

Today's trade and opening gap could signal the end of the move as buyers have exhausted themselves. Certainly, the ending diagonal (wedge pattern) that I called to your attention in the later part of the day on Twitter would support such a conclusion. If w.iv is complete, a loss of 1170.5 should be the first sign that the larger degree trend has resumed. As always, look for a five wave impulsive move to confirm the break.


However, counting the move from 1113.75 (w.(b) low) doesn't count well and after reviewing the analogy, the w. b zig-zag (not labeled --- 1262-1397.75 in 2007   -- see weekly chart above) was small. Therefore, I'd like to offer this alternative interpretation (notice I didn't say alternate) that better suites both the analogy, current price action and termination levels of 1225-30 established by my earlier analysis.

From a trading perspective, the later count, if correct, will play out as inexperienced traders get caught in a a bear trap, thinking that the ON session or early weakness in the daily session will lead to new lows. It might but we know that 1170 MUST FAIL to bolster the near term bearish view.

We'll leave it there for tonight and see what develops.

Best of Trading


Wednesday, May 25, 2011

The Market Pulse

Announcement:

I neglected to inform readers in Monday's post that the ending diagonal interpretation was eliminated due to the fact that to many rules and guidelines were violated as the pattern progressed.


Tonight's post will be short as much of the larger wave pattern remains unresolved. Sticking with the near term wave structure, we have six completed waves if w.(b) ? has ended. That leaves one more decline to complete a double zig-zag that began at 1367.25. My target for the termination of the structure remains where w.z = w.w at 1294.25. Only a loss of 1324.5 would cause concern.

Best of Trading


Wednesday, May 18, 2011

Before The Bell: $ES_F Intraday Chart


This chart is a follow up to yesterday's session and my previous analysis.... calling for 1314 bottom. Notice the support levels of 1314.5 and 1319.75. The Market traded to 1316 the end of w.iv circle. The wave pattern from w.iii circle counts well as a zig zag which are usually found within diagonal patterns. Notice that the subdivisions also count well for w.(c) of w.iv circle. However, the ON session's price action looks choppy and also corrective. Be on guard that the move to 1316 is only part of a larger structure and that we have not seen the end of selling. If the count is indeed correct, then 1316 is critical support. One tick below and the interpretation is suspect.

I hope you found this information helpful and...

Best of Trading.

Tuesday, May 10, 2011

The Market Pulse

Today's post will be brief and a supplement to the weekly edition of Heard On The Street.


The Emini S&P appear to be following the script laid out calling for an ending diagonal. Yesterday, prices rallied and RSI has so far failed to break the 40 line , a point where further bullishness would be questioned. The fact that the indicator bounced of the 50 line instead of even testing the lower 40 line bolsters my bullish view.


At the intraday level, the subdivisions of w.5 are labeling and I am expecting another up, down up sequence to complete the pattern.

I hope you found this information helpful and ...

Best of Trading

Thursday, April 7, 2011

ES_F: Alert


Here's the updated chart. Notice that the pattern resolved within 1 bar of the anticipated retracement of w.v circle. If you missed last nights post that covered this scenario, you can read more at : http://elliottwavelive.blogspot.com/2011/04/market-pulse_06.html

One caveat... the sudden drop MUST confirm i.e. by making a five wave decline or the larger implied decline (w.3 circle) is flawed.

Let's watch the show.


Best of Trading

NOTE: I will be unavailable and offline from 12 pm est. for the remainder of the day session.

Wednesday, April 6, 2011

The Market Pulse

The ES_F opened with a furry but the gap was quickly closed, then the market spend the remainder of the session in range bound trading.There are essentially two scenarios: a fourth wave triangle or an ending diagonal. Regardless of which interpretation prevails, tomorrows session will quickly expose which pattern is correct.


The ending diagonal implies that the top completed at today's open. While I don't have the structure labeled, the decline from 1335.75 could be counted as a five wave decline, followed by a three wave countertrend move.


A challenge of w.iv circle (1324.25) within 50% of the time the pattern took to form would bolster this view. W.v circle took 46 bars. The 50% time relationship implies that the w.v circle will be retraced within 69 bars(start to finish). 50% of 46 is 23 bars. Since 20 bars are already present, 3 price bars remain.... so w.v should be retraced by 10:30 am EST. As with any time relationship, it's not an exact science so I would give the relationship some leeway. 


The second scenario is a fourth wave triangle where the pattern is not complete but should resolve to the upside tomorrow after a small decline to complete w.(e) either in the ON session or early on in the day session.

As soon as I can determine which scenario is correct I will update readers with either upside or downside targets.


Best of Trading