Thursday, July 29, 2010

Elliott Wave Live: Market Wrap for July 29, 2010

Last night I mentioned " If a w-x-y 4th wave correction completes as indicated, a potential trade setup may materialize where we have wave w=y at 1096 which is also located at the most common Fib retracement for 4th waves of .382. This also is where the previous breakout occurred at A (red). Should provide support and a high probability trade with minimal risk. Any trade above 1113 would most likely indicate that the correction was over".

Well, the Alternate count may have been correct as 1101.25 was slightly exceeded, followed by a retest of 1113 that failed, on an opening gap ( see lower time frames),  followed by a 5 wave decline. So , I was right on the desired direction but then 1096 didn't hold.

Based upon the wave principle, C waves are 5 wave structures. If you were counting the waves, it kept you out of trouble. We didn't have a complete 5 wave move down until 1088.75. 1088.75 was also a .50 retracement between waves ii and iii. That is still an acceptable retracement for wave iv. The Bullish Hammer confirmed that wave C had terminated  giving a trader the opportunity to go long. If  anyone took this signal, don't let your profit get away. The current move down from 1104.5 can't retrace more than 1088.75 to maintain the bullish posture for a wave v of ii circle.

Best of Trading!

Wednesday, July 28, 2010

Elliott Wave Live: Daily Market Wrap for July 28, 2010

Traders,

I will be traveling over the next few days. I will have limited internet but will try to make some posts in the evenings.

Best of trading!

Elliott Wave Live: Mid Day Review for July 28, 2010

A Potential Area Of Interest 

This is my current view of the market as well as the anticipated direction moving forward. If a w-x-y 4th wave correction completes as indicated, a potential trade setup may materialize where we have wave w=y at 1096 which is also located at the most common Fib retracement for 4th waves of .382. This also is where the previous breakout occurred at A (red). Should provide support and a high probability trade with minimal risk. Any trade above 1113 would most likely indicate that the correction was over.

Best of  Trading

Elliott Wave Live: Pre Market for July 28, 2010

Not much action overnight. The market continued choppy price action overnight. Nothing is resolved as to whether a larger wave iv decline will unfold.

Best of Trading

Tuesday, July 27, 2010

Elliott Wave Live: Market Wrap for July 27, 2010

Hey Wavers,

I'm running really late with this but my wife had a death in the family. Tonights post will be brief. I believe we are in the 4th wave of C of wave 2. The pattern appears to be building a triangle but we need more price data to be sure. Other downside potential exists below 1106. Once wave 4 is complete, upside potential is 1127-1139 area. I will add more Fibonacci price targets when they become available.

Best of Trading!

Elliott Wave Live: Mid Day Review for July 27, 2010

Early gains from the open have been retraced but the price action doesn't appear to be impulse to the downside. This suggests that wave iv is underway and wave ii (circle) still has upside potential. 

Best of Trading!

Still Higher! Elliott Wave Live: Pre Market for July 27, 2010

STILL HIGHER

The overnight session has pushed prices higher. Expect a gap open. We'll have to see if the gap up is an exhaustion gap or that of a continuation gap.

Best of Trading!

Monday, July 26, 2010

Churning Higher! Elliott Wave Live: Market Wrap for July 26, 2010

CHURNING HIGHER

The market has clawed it's way up to the first major set of Fibonacci levels (1108 - 1112) on lower volume and tested the 200 sma of 1110. 75. In addition, I mentioned several divergences in the Mid Day Review that signal that a near term top may be forthcoming. Review the post if you missed it.

There remains no change in my market forecast otherwise. ( See Week In Review: July 25, 2010 ).

Best of Trading!

Elliott Wave Live: Mid Day Review for July 26, 2010

Trade has continued it's march higher but momentum seems to be slowing as measured by the ROC indicator. Price has reached near term resistance between 1108 - 1112. So at the very minimum, I expect to see the market to react to these Fibonacci levels. The extent of any pullback is unknown but there are other clues of near term bearishness building:
  • The RSI may now be signaling a top.
  • The MACD is showing divergence.
  • Small real bodies on candlestick charts.

Will this be the end of wave 2 or do we have more upside? Look for 5 waves down of impulsive nature to confirm that wave 2 has indeed ended.

Best of Trading!

Sunday, July 25, 2010

Elliott Wave Live: Week In Review for July 24, 2010

Are The Bulls Still Down For The Count?
Ouch. It was not a good week for the bearish case. The S&P gained 3.55% for the week. It appears that the operative wave (iii) of 3 down count that was widely held by fellow wavers is now dead as price rose above critical resistance (1096). With that said, many readers would like to know where are we in terms of the near term count. So let's dive in and see if the Bulls are really down for the count.

First let's look at some market internals that still favor the Bearish case. NYSE volume has declined throughout the current rally that began on 7/1/2010. Downside volume (albeit light) has been greater throughout. That does not bode well for the Bulls. Upside volume has been muted. ADV_DEC remains in a decline from the high established on 5/10/2010. It would be fair to say that the Bullish case is less than impressive. Could that change?

Two Counts Left For The Bears!

Trade is nearing a point where I believe the third wave labeling must be forfeited. Any break above 1127.5 busts that count and forces alternative labeling. For the sake of argument, the operative count remains that we are in wave ii (circle) of 3 down. However, price has carried to the .786 retracement and I don't place much faith in the level holding. My expectation is for 1127.5 to be tested near term. So let's explore two other "alternative" bearish counts.

A Zig-Zag Correction

The chart depicts a zig-zag correction that is unfolding from 1006. Upside potential as measured by Fibonacci expansions are:

Wave C= 1.618 Wave A @1198.5
Wave C=  .618 Wave A past Wave A @ 1151.62
Wave C= Wave A @ 1043
Wave C=.618 Wave A@1108.5

There are also two other key resistance areas that come into play near term: The 200 sma crosses 1110.75; a 50 % retracement is 1112.25 and the market reaches overbought territory at 1112 on Monday. The Fibonacci data clusters lie within the previous 4th wave of a lesser degree, which often coincide with termination points.  So near term, I'll be closely watching the 1108 - 1112 area for sell signals and the possible termination of wave 2. Five waves down from there and in an impulsive manner would bolster the case that wave 2 had indeed ended and we are beginning wave 3 down.

Oh No! Price Trades Above 1127.5. Now What?

Should 1127.5 be breached, we must consider another alternative scenario. One which removes any possibility that wave 3 of 3 had even begun. In this case, a serious blow would be dealt to the bears much like going "all in" on a poker hand with no pairs, then failing to convert.

Under this scenario, you should note the different labeling for the termination of wave 1 down. I have purposely left the operative count on the chart but for a reference point I have presented the "Alternate Count". Under this labeling, an expanded flat would be unfolding with the following termination points:

Wave C=1.618 Wave A @ 1202.5
Wave C= .618 wave A past Wave A @ 1202.59
Wave C=1.386 Reverse extension @ 1174


Cover of "Tin Cup"
Bottom Line: Next week should be a defining moment. Will the Bulls go down in flames like Roy Mac Elroy, "Tin Cup" did on the final hole in the US Open?

(Story to be continued).

Best of Trading?


e
Enhanced by Zemanta

Friday, July 23, 2010

Elliott Wave Live: Mid Day Review for July 23, 2010

The market remained range bound until the EU announced the results of their Bank Stress Tests. Trade has now breached the key resistance area of 1096, closing the door on any idea of a 3rd of a 3rd wave count. It's important to keep in mind that the larger trend is still down while honoring the fact that we are still in wave 2. More insightful analysis in the End of Day Market Wrap and Week in Review. Stay tuned.

Best of Trading!

Elliott Wave Live: Pre Market July 23, 2010

There is no change from last nights Market Wrap. 1096 hasn't been breached.

Best of Trading!

Thursday, July 22, 2010

Elliott Wave Live: Market Wrap July, 22, 2010

RUN WITH THE BULLS OR HUNT WITH THE BEARS?

Today's sharp rally stopped a few point from critical resistance (1096). If we are truly in wave three down, then trade has no business above this key level. Even the slightest breach intraday would bust the count and force a reconsideration of alternatives. So that leaves us pondering whether to run with the bulls or hunt with the bears?

Tomorrow, the Bears MUST take control to maintain a wave 3 count. If not, we have our alternate count already in place and the bullish counter trend rally will march on ( See chart). There are also several other possible ways to explain the current structure. If price structure warrants, I will bring them to your attention.

Best of Trading!

Elliott Wave Live: Mid Day Review July 22, 2010

Trade has remained impulsive in nature. Although the prior operative wave count remains alive, any trade above 1096 would bust that count forcing me to reevaluate the near term wave count. The chart assumes that 1096 will not hold. Should the .786 retracement be breached, odds are that the high set on 6/21/2010, (wave 2 blue), will be challenged. A breach of that pivotal high, opens up the alternate count that I laid out last night.

Best of Trading

Elliott Wave Live: Pre Market July 22, 2010

Last night I provided an alternate count for the Market. Should the operative count fail, the alternate becomes our road map. Having both prepares us for any development in the near term. In the overnight session, wave i of wave (iii) ended in a truncated 5th wave. Early action suggests that wave ii is unfolding.

Best of Trading!

Wednesday, July 21, 2010

Elliott Wave Live: Market Wrap July 21, 2010

Hello Fellow Wavers,

I'm back from a well deserved vacation and I am playing catching up with the e-minis. Tonight's market wrap will be brief but certainly stimulating as I'll offer an alternative wave count to the "herd's" consensus count. So let's dive right in.

The following chart is the labeling of Elliott Wave Internationals analysts. The current count is wave 3 down. Since third waves are destructive, the price action should have the following personality: a prolonged decline, significant volume, high VIX, and extreme tick lows. You might ask why I am providing this information to you. Well, it is of my subjective opinion that the high of wave 2 (blue, 1127.5) did not mark the beginning of wave 3 down.


 One could argue the following to support my claim: (see chart below commentary)

  • Third wave volume should be greater than that of wave 1. Volume was higher in wave 1(blue) and is currently declining rather than expanding. We could attribute this to the summer doldrums but we have seen volatile swings in both directions, yet downside volume has been muted. NYSE total volume ( not shown), exhibits similar traits.  

  • The TICK, as a momentum gauge recorded -934 during wave 1 for the S& P Cash and has failed to take out that low reading during the third wave.

  • As a measure of fear, the VIX has remained relatively low compared to the "fear" that should occur during a 3rd wave.


Now I'd like to suggest a possible alternative wave count that I feel better explains the most recent price action. From the chart, wave 1 was a "Leading Diagonal", instead of a 5 wave decline. The pattern terminated at 1006. The ensuing retracement ( wave 2, blue) is still unfolding ( see chart). The near term wave pattern from A ( red) appears to be a zig-zag ( 5-3-5). On lower time frames, I can't count a completed 5 wave pattern to complete wave c ( green) of B ( red). In addition, today's daily "Dark Cloud Cover" candle pattern signals continued weakness in the near term. My expectation is for price to test 1042.5- 1040.5 area, whereas, wave c ( green) = wave a (green) at 1042.5, then rally up to 1136 to complete wave 2 ( blue) Thereafter, wave 3 will begin.

So how do we know which count is right?

For the "herd count to prove itself, price MUST decline below well below 1006 and can't exceed 1127.5. These are the lines drawn in the sand. Market internals must reflect that of a 3rd wave personality, i.e. the VIX needs to reflect extreme fear real soon; volume must expand and exceed that of wave 1. Downside momentum, measured by TICK, should reach a new extreme low. If not, the current count, either near term or of the entire decline from 4/26/2010, may be in jeopardy and therefore opens the door to alternative wave counts.

Stay turned.

Best of Trading!


Sunday, July 11, 2010

Elliott Wave Announcement

Hi Everyone,


I will be on vacation from 7/12- 7/20 and will have limited access to the Internet in the mountains of Colorado. Have a great trading week.

Friday, July 9, 2010

Elliott Wave Live Pre Market: July 9., 2010


As as reminder, I will be at a conference today but I got up early to post this information so that you can add it to the termination data that was provided in last nights Market Wrap. Please review that post if you already haven't read it. At the daily chart level, wave c= 1.618 wave a at 1074.

Best of Trading

Thursday, July 8, 2010

Elliott Wave Live Market Wrap: July 8, 2010

Note: I will be attending a conference tomorrow so there will not be any pre-market or mid day review.

Today the market continued it's march higher. After completing wave (iv), prices rallied into the close in what may be wave iii of (v) of c of ii (circle). So my expectation for tomorrow is almost identical as today. Look for a minor decline- followed by a final push up. There are two remaining gaps. One at 1070 which is almost certain to be closed tomorrow since the current wave up doesn't count 5 waves. The other lies at 1082.5 Each are labeled with grey lines.

There are several wave ii (green) termination points that can now be determined (see attached chart). Once complete, the market should be in a 3rd of a 3rd which should bring prices swiftly below 1006. When wave iii (circle) begins, I'll be watching the market's reaction very closely to see if the price action meets the personality of a 3rd of a 3rd wave. Maybe that's a discussion for the weekly wrap up. Let me know.

Best of Trading!
Enhanced by Zemanta

Elliott Wave Live Mid Day Review: July 8, 2010

Trade continued up as I anticipated. The market gaped up then met resistance at .50 retracement of wave i (circle), and the structural divide of the previous 4th wave. The gap has since been closed and wave (iv) may be developing.


Best of Trading!

Elliott Wave Live Pre Market: July 8, 2010

Good Morning.

The overnight session is flat, and the market is overbought. We are currently working wave (iii) of (v) of c, of wave ii (circle) at the 60 minute chart level.  It is possible that wave (iii) ended yesterday and wave (iv) is forming in the pre market session. More price data would be needed to confirm this assumption. So I'll be looking for a modest decline early on today, followed by a final push up. When wave (iv) has completed, I will be able to generate termination points for wave ii .

Best of Trading!

Wednesday, July 7, 2010

Elliott Wave Market Wrap: July 7, 2010

Yesterday evening I said that prices would continue to rally in today's action. Well they certainly did. As I cautioned, a price brake of 1038.5, paved the way for a larger retracement and operative wave count of wave ii (circle) unfolding. I've attached a chart showing that count. There's a great lesson that can be learned by watching the price action that unfolded in today's rally. Did the market offer any clues that told you that my operative wave count was wrong, even though my direction assumptions were correct?

Last night I also mentioned a potential short trade set up, that didn't materialize... looking for the possibility of a small move up then to new lows ending at wave i (circle). In that statement, stops were above what I'll call "critical resistance" of 1038.5. For those of you who are new readers of my posts, the reason that 1038.5 couldn't be exceeded is that wave ii can't exceed the origin of wave i or I was wrong ( see last nights post for comments and labeling). At the open, prices gaped up and within 1 hour had added 19.75 points to yesterdays close. That was your first warning that an extended move was underway. One that may not be a minor bounce as anticipated. The second clue that a short position was not prudent was the break of the corrective channel lines and the thrusting price action (vertical in nature). Also, if you look at a candlestick chart (not shown) you can see that each bar was long and closing near or at their highs. Another sign of strength. A fourth and final clue that the trade wasn't viable is that prices exceeded the .786 retracement without even a minor pullback. At that point traders should be looking at the alternate count because the likelihood of prices exceeding critical resistance was great.

So the lesson learned is that our wave count is our guide to the anticipated direction of the market. As price unfolds, we must review price in the context of what we expect to occur. When price doesn't confirm or analysis, it's best to stand aside until the wave count resolves itself. If you viewed today's market action with this mindset and accepted what the market offered, a Short was out of the question.

Moving forward, the market seems to be after the gap that closes at 1070.5 that is also located near the previous 4th wave. There is also a gap higher that closes at 1087. We'll have to monitor the wave count as wave c of wave ii progresses to determine is any of these higher objectives can be reached. When wave ii is complete, the next leg down will lead to significantly lower lows.


Best of Trading!

Tuesday, July 6, 2010

Elliott Wave Market Wrap: July 6, 2010

Today's session was certainly exciting. Prices gaped up at the open and remained strong for the first hour of trade, then the market sold off before staging a comeback. Unfortunately, nothing has changed from the mid day review. Either wave (iv) has completed and the current move down is wave i of wave (v) of wave i (circle) or wave ii (circle) is still unfolding. Given the proportion of the decline from wave 2 blue, I don't think that today's market action completed a small wave ii (circle). Therefore, while the wave labeling  is unresolved, I am anticipating a continuation of today's rally. The depth of that rally will determine which labeling is correct. If prices have a minor bounce to wave ii (blue) then I would think that the operative wave count is that as depicted in the chart whereas we are working a fifth wave down to complete wave i (circle). If you recall wave ii can't exceed the origin of wave i according to Elliott rules, therefore should price breach 1038.5, then the operative count would indicate that wave ii (circle) was unfolding.

I think tomorrow will provide a good short trade opportunity with stops just above 1038.5 if the current wave up unfolds in only 3 waves.

Finally, I will be at a seminar tomorrow so there will not be any posts until the end of market review.

Best of Trading

Elliott Wave Mid Day Review: July 6, 2010

Prices gaped up at the open leaving two possible scenarios as labeled on the daily session chart. Prices have tested two minor resistance areas in what may be 5 waves. If the current decline is unable to decline below 1029 ( ES1-057) and 1032.5 (ES-057), then the move up may extend to 1043.5 - 1044.75 at a minimum. However, should 5 waves down develop from 1038.5, then the trend down would most likely continue in either a fifth wave of wave i circle or wave iii of 3.

Elliott Wave Pre Market: July 6, 2010

In pre-market trade, price action seems to be exhibiting impulsive behavior which may mean that wave i ( green, circle) of wave 3 is complete. A break of 1032.5 and the presence of 5 waves up would be required to consider this view. Until then, the trend remains down.

Best of Trading

Sunday, July 4, 2010

Elliott Wave Weekly Review: July 4,2010

Happy Fourth of July.

As we celebrate our independence here in the US, many forget to reflect upon the significance of holiday events and dismiss the chronological order of events that are significant in history. As a trader, I'm always looking for an edge over the guy on the other side. To see what he doesn't! So before I break out the BBQ and fireworks, I decided I needed to be a historian and study other Bear markets in an attempt to create a working model for future price.

I began my research by reading an article on the Crash of 1929 and the Great Depression. I have taken some excerpts from it and highlighted many similarities to what I believe is unfolding 81 years later. Draw your own conclusions; keep an open mind as the price projections are quite unimaginable to a modern day investor/trader. Remember,stock market crashes are a social phenomena combined with economic events and crowd (the herd) psychology. These patterns repeat but do not always manifest themselves exactly the same.

The October 1929 crash came during a period of declining real estate values in the United States. The psychological effects of the crash reverberated across the nation as business became aware of difficulties in securing capital markets investments for new projects and expansions. Business uncertainty naturally affects job security for employees, and as the American worker (the consumer) faced uncertainty with regards to income, naturally, the propensity to consume declined. The decline in stock prices caused bankruptcies and severe macroeconomic difficulties including contraction of credit, business closures, firing of workers, bank failures,decline of the money supply, and other economic depressing events. The resultant rise of mass unemployment is seen as a result of the crash, although the crash is by no means the sole event that contributed to the depression. The Wall Street Crash is usually seen as having the greatest impact on the events that followed and therefore is widely regarded as signaling the downward economic slide that initiated the Great Depression. (i)

Other Similarities

Wall Street bankers met to find a solution to the panic and chaos. Bids to purchase a large block of shares in "blue chip" stocks were deployed. This tactic was similar to a tactic that ended the Panic of 1907, and are currently being used today by the Federal Reserve and Treasury. History shows that these efforts are temporary at best.

At the time of the Crash, the prospects for passage of the Smoot–Hawley Tariff Act was then being debated in Congress. The Act, proposed the raising of tariff taxes on 20,000 US imported goods. Economists later concluded that the large swings of price prior to Black Tuesday were a result of uncertainty created by the passage of this Act. In my opinion, the Obama Administration's Health Care and Banking Reform bills carry equal weight with investors.

If prosperity defined the "Roaring 20's" as more than just an economic condition, could we not argue that prosperity is a "state of mind? If so, the Crash signified a change in psychology.

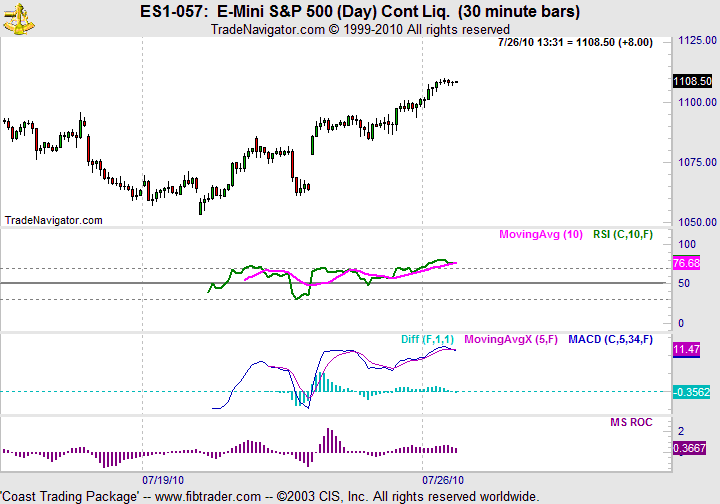
Given these similarities and the fact that psychology plays a huge role in financial markets, I decided to use the Crash of 1929 as a working model for the period of 10/2007 to present. From the chart of the cash S&P from 1929-1932, I've compared the magnitude of decline to that of 2007- present.

Magnitude of Decline

1929-1932

  • The total decline from 1929-1932 was 87%.
  • Wave b retraced 61.8 % of wave a.
2007-present
  • Wave a and b are 64 times greater in magnitude as their counterparts in 1929-1932.
  • Wave b retraced 61% of wave a.
  • Total decline - still unfolding
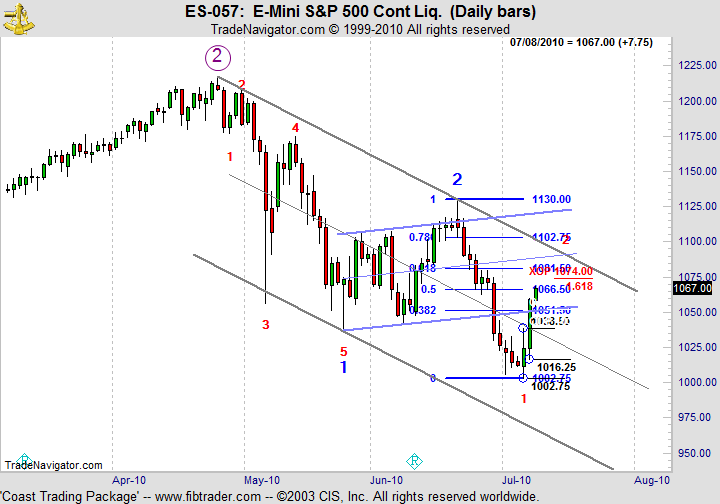
 Potential Support Levels

So far the analysis has revealed a similar retracement of the b wave. By using the magnitude of decline from 1929-1932 (87%), along with Fibonacci Ratio Analysis we can project the termination of wave c.

Fibonacci Ratio Analysis

The following information represent termination points of wave c using an expanded flat interpretation or the alternative count, a zig zag, not show, whereas III, purple, circle ended where b, green is designated and 1 is a and 2 is b). See chart below. The calculations are:

Expanded Flat:
  • wave c=.618 (wave a) past wave a @299.58
  • wave c= .618 wave a @ 283.97
  • wave c =1.618 wave a @307.19
Zig- Zag: 
  •  wave c= wave a @ 310.5
  • wave c=.618 (wave a) past wave a @ 104.84
  • wave c= .618 wave a @ 657.85
  • wave c =1.618 wave a @ (251.45) - excluded negative number
Magnitude of Drop Analysis

If the crash of 1929 ended in a 87% decline, what would a decline of parity be equivalent to today? If wave III ended on 3/2000 @ 1552.87, then wave c would terminate at 201.87. If wave III ended on 10/2007 @ 1576.09 then wave c would terminate at 204.89.

But is looking at an event of parity realistic, given the parabolic rise from 12/74 to 12/2000? Probably not given that the current waves are 64 times as large! Case in point, parabolic rises produce unsustainable prices at market tops that usually lead to dramatic collapses in the oppositedirection. Another excellent example is  Crude Oil (2007 and 2008).

For argument sake, lets look at a 90% decline to see how a few extra percentage points effect the termination points. If wave III ended on 3/2000, a 90% decline terminates at 155.29. If wave III ended on 10/2007, then wave c terminates at 157.61. There may be other multiples of decline that agree with support provided by previous 4th waves but this analysis doesn't take those into consideration. Should they be warranted, they can be addressed at that time.


Conclusions
The following chart shows bands of support drawn from my research. Use them as a general guide as price structure continues to unfold. As in any long term analysis, these projections will play out over years, not months. Certain events may force us to change or reconsider our viewpoint and strategies. When and if applicable, I will do so.

Best of Trading!


Enhanced by Zemanta

Friday, July 2, 2010

Elliott Wave Market Wrap:July 2, 2010

There is very little to review tonight based upon today's uninspiring session. I have made one minor change to my early morning wave count to account for the possibility of an alternate wave count. In accounting for this change, I also changed the subdivisions that seem to be a better fit heading into Tuesday's session based upon today's price action.  Neither change negates that the fact of the larger trend is down which has been consistent throughout.

I will be producing a special weekly wrap review sometime during the weekend comparing the 1929 crash vs current market conditions along with a more detailed analysis so that everyone can be ready for Tuesdays market open. You  don't want to miss this. In the mean time have a safe holiday.

Best of Trading!

Elliott Wave Live Mid Day Review: July 2, 2010

Trade is sideways as traders are probably already hitting the beaches for the holiday. Trade challenged the 1030.25 level that I referred to in last nights post, then turned minimally down . As long as trade remains lethargic, it's best to stand aside.

Best of Trading!

Elliott Wave Pre Market: July 2 , 2010

The market remain little changed in the overnight session. With the anticipated jobs report due out at 8:30 am est., traders are not committing. One note of interest. Should  (B) 1019.75 hold and the jobs report not tank the market , the corrective rally that I spoke about in last night's "Market Wrap" might just play out between 1041.75 - 1055.25. As you know, corrective waves typically terminate at the previous 4th wave of one lesser degree. So the current wave count offered may be correct as long as key support isn't breached. Please review last nights post for details on support and resistance and  more detailed comments.

Best of Trading! 

Thursday, July 1, 2010

July 1, 2010 Market Wrap

For tonight's daily wrap up I thought that I would revisit a few charts that I posted earlier in the week to illustrate how they fit within the current price structure. The weekly chart hit a significant support area today at 1006 and is beginning to bounce. We may have seen the termination of wave 1 of 3 today on a daily basis.

If you recall I mentioned that I would get really excited if the daily price action could confirm 5 waves down and a three wave counter trend move  to complete wave 2. It is uncertain whether the market can challenge previous pivot lows of  1 (blue) at 1036.75 or B (red) at 1041.25. A .382 retracement would fulfill the minimum requirements for a 2nd wave retracement. However, most typically, wave 2's are deep retracements of (.5-.786), with a .618 most typical.  A break of 1041.25 would indicate that a larger counter trend move was unfolding. So caution is still warranted at this critical level. I've draw in a proposed 3 wave move in blue ( not to scale in terms of time), just to give a visual aid to what the price structure would look like if the market can break 1041.25. Just focus on the level and identifying three waves up to complete wave 2. Any break below 1006 implies that wave 1 (blue) isn't complete.

Big picture - Since this is a 3rd wave there can be no assurances as to the measurement of the markets mood. Fear and panic will set in in a 3rd wave of a bear market, as those who recovered some of their losses from 2007 will quickly realize that they won't get back to even and be forced to sell or lose even more.


Best of Trading

July 1,2010 Pre Market Call - Follow Up

A winning trade! In my Pre market call I wrote, "short sellers should be looking for the termination of a three wave structure either in the pre-market or in the regular session to posture ourselves short for another move down". Here's the continuation chart for your review. By 10:00 am est, the e-mini completed an ABC corrective pattern whereas wave c= wave a at 1028.75. Prices exceeded this level slightly as I believe that larger market participants were gunning for the nest of stops just above 1027.75. After cleaning  up the floor, the market resumed its previous downtrend to the tune of 23.75 points per contract.

Best of Trading

How to subscribe to my blog

Readers often visit a blog and enjoy it but either fail to return or find it to cumbersome to visit the site on a daily bias. Here's a solution. You can subscribe to the blog using RSS feed located at the top left hand column of the blog.

Enjoy

Why become a follower

Is this your first visit or are you a repeat visitor? If you want to let me and other readers know that you are a fan, there are several ways to become a follower of my blog. One of the easiest ways is to click on the "Follow" button at the top left hand of the navigation bar or under the "Followers" widget in the left side margin: For more details you can visit: http://www.google.com/support/blogger/bin/answer.py?hl=en&answer=104226

I hope you find my blog enlightening.

Best of Trading

Elliott Wave Pre Market: July 1, 2010

Good Morning.

Often, when the market throws us a curve ball and forces us to re-evaluate our wave count, I like to remove all labeling from my chart and focus on waves in isolation rather than as a whole. In doing so I can still find high probability trade setups and let the market resolve the count for me as more price data is filled in on the charts from the right. Let's take a look.

Let's focus on the price action from yesterday's tradeable top (1044.5) on the 30 minute chart. The over night session produced something very interesting. Five waves down! My point is... we don't have to worry about the subdivision labeling from the high of 1127.5. According to the wave principle, we know that 5 waves is followed by a 3 wave structure. Therefore, short sellers should be looking for the termination of a three wave structure either in the pre-market or in the regular session to posture ourselves short for another move down.

Best of Trading!