Showing posts with label Elliott Wave Patterns. Show all posts

Sunday, July 29, 2012

Silver Tongue Chart

Recently I was reviewing some charts of markets that I don't actively trade and I came across the chart of Silver.  
By definition,  "Silver Tongued" is having or exhibiting the power of fluent and persuasive speech; eloquent.

The monthly, weekly and daily chart levels of Silver are eloquent indeed. 

Watch my video, entitled,  "The Silver Tongue", a monthly, weekly and daily chart level discussion of Silver futures; dominant elliott wave patterns and SLV (silver etf). 

See how I'm approaching this market.

Best of Trading 


======================================================================
ElliottwaveLive is not an investment advisory service or broker dealer. None of its contributors are registered investment advisors, licensed stock brokers or CTA's. The author may hold short term and long term positions in the futures, stocks and ETF's discussed herein. The author may also trade around those positions which may be in direct conflict with your positions. Complete trade disclosures of the contributor’s holdings are posted at www.elliottwavelive.blogspot.com. See Trader Disclosure. 

Trade at your own risk. The blog site, Newsletter and all other information, material and content accessible from this Site (collectively, the "Content")  provided herein provides the context for market analysis with respect to a market's, a security or a commodity's general position utilizing the Elliott Wave Principle. The Content contained herein are the opinion and general comments of the author and is based upon information that Mr. Sinibaldi considers reliable but neither ElliottWaveLive nor he warrants it's completeness or accuracy and it should not be relied upon as such. Mr. Sinibaldi or ElliottWaveLive (collectively, referred to as “EWL”) are not under any obligation to update or correct any content provided on this website. Any statements and or opinions are subject to change without notice. The content and comments contained herein neither purports nor intends to be, specific trading advice. It has been prepared without regard to any particular person's investment objectives, financial situation and particular needs. Information should not be considered as an offer or enticement to buy, sell or trade. 

A more and comprehensive Risk Disclaimer and Disclosure Statements is available within the left margin of this blog site. 


Sunday, April 24, 2011

Heard On The Street

The S&P has rallied off the 4/18/2011 low but is the market really heading significantly higher or is danger lurking? Learn more by viewing this weeks video edition of Heard On the Street .


Best of Trading

Friday, February 25, 2011

S&P Update and Trade Plan


As most of you know, I like to wait for confirmation that a trend change has occurred before placing my money at risk. The updated chart above shows that a five wave decline has occurred that should lead to a three wave advance.. a counter trend move. Note that I'm not calling the top for the year here, just a potential trade set up. For more detailed insight on the ES_F current market position click here. For today, I'm looking to identify the termination point of the wave B trigger to go short the market. I'm initially looking for failures surrounding 1317, the .5 retracement of the most recent decline from 1343 to 129250.

I have found that trading waves 3,5, and wave C are the best waves to trade... each are set up by the "trigger waves" of 2,4 and wave B.


Looking at the five minute chart level, w.c = w.a at 1318. So 1317-1318 is agreement. That's my area to enter the market and ride the trend in w.iii circle down.

Best Of Trading

Monday, February 21, 2011

Heard On The Street: #ES_F #Oil #Gold #Copper

The US Markets are closed today but you can still prepare for tomorrows trade by watching my video update of the S&P, Oil, Gold and Copper.


Best of Trading

Sunday, February 6, 2011

Heard On The Street: Three Topping Markets

The US and other world markets continue their advance. While investors believe that they're on a one way street heading north, Elliott wave patterns suggest that a u-turn pivot is near for the S&P, DAX and the FTSE100.


To gain unfair advantage over other traders and a detailed perspective of significant resistance, target areas and wave structures...  view this brief video update.


Best of Trading

Wednesday, February 2, 2011

The Market Pulse

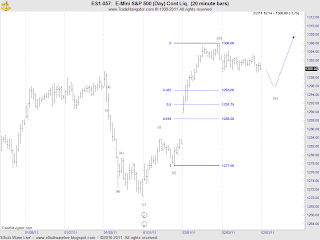
The last time we spoke I left readers with the possibility that w.(2) had ended at 129950 and the appropriate wave labeling as contained here at :

http://elliottwavelive.blogspot.com/2011/01/market-pulse-s-and-crude-oil.html

That's not what transpired as the wave count was blown out after two days of advancing prices. While I was absolutely WRONG, two valuable lessons can be learned.

1. From the labeling in Monday's post I showed a completed five wave decline which had me looking up as the Elliott rules and guidelines state that a five wave structure is followed by a three wave countertrend structure. However, in the case of my incorrect assessment of the market, what I should have been looking for is another five wave advance to new highs (more on this later). My point is... that even though I was wrong on the wave labeling, the minimal expectation was at least a three wave advance.... thus from a directional standpoint I was right.

Here's why:


If a trader acted on the completion of the decline from 129950 to 127050, then the probability of price movement in the desired direction (up) would be likely because only two possibilities existed:

i) That the decline ending at 127050 was a C wave or,
ii) that the decline was wave i.

Bottom line: Both scenarios called for higher prices giving a trader confidence in executing a trade. Traders using the wave principle should always look for a minimum of a three wave structure in the anticipated direction.

2. Waves are fractal in nature, i.e. that smaller wave structures make up larger wave structures. My failure to evaluate the daily higher time frame caused me to prematurely call the top.


Here is the previous daily chart showing that w.(2) had ended. While I can and certainly did make a case for this wave labeling, it was incorrect.

Here is the revised labeling.


Looking at the wave structure from w. iii circle to w.iv circle, the pattern is a three wave decline. That's corrective. Now looking back at the 60 minute chart level that was presented earlier, notice that the decline from 129950 to 127050 was w.c at the daily chart level. Had I looked at the 60 minute fractal and then reviewed the daily chart level, I would have had a better idea that w.(2) wasn't indeed completed.


Let's look at the current advance from 127050. The market has completed w.(iii) and w.(iv) is unfolding. According to the rules and guidelines of EWP, second and fourth waves follow an alternating pattern. Since w.(ii) was sharp, w.(iv) should be a sideways correction. That's whats occurring.

The most common Fibonacci relationship for fourth wave declines is .382 ;therefore, I'll be looking for a completed pattern near 1295 that will be followed by another five wave impulsive move to new highs.

I hope you have found this information helpful.


Best of Trading