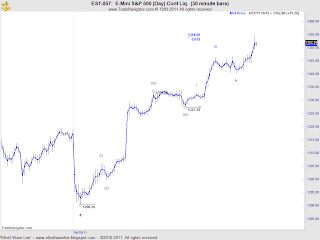
Lacking any clear evidence of a five wave decline from either market, the wave count MUST continue to look higher. There are numerous other ways that one could count these markets. I'm providing counts that seem most appropriate at the present time. Readers should use the counts provided as a foundation to produce other bullish counts as the days ahead unfold. My expectation is that the eventual correct counts will reveal itself as the pattern matures.
SPX
W-X-Y
This is currently my preferred count.
A-B-C Rare C Wave Ending Diagonal
According to Robert Precter, p (37) of the Elliott Wave Principle, " a small percentage of diagonals appear in the C-wave position of A-B-C formations." Therefore, although a valid count, odds are that this count represents the less probable outcome for price progression.
Note: one should keep in mind that an expanding triangle interpretation exists at quarterly chart level that would carry price above 2007 levels. Resolving that count at the weekly chart level can't be supported at this time by weekly interpretation.
DOW Futures
Much like SPX, Dow represent a similar pattern.
I'll be providing periodic updates with respect to these charts. Let's leave it there for now and ....
Best of Trading
======================================================================
ElliottwaveLive is not an investment advisory service or broker dealer. None of its contributors are registered investment advisors, licensed stock brokers or CTA's. The author may hold short term and long term positions in the futures, stocks and ETF's discussed herein. The author may also trade around those positions which may be in direct conflict with your positions. Complete trade disclosures of the contributor’s holdings are posted at www.elliottwavelive.blogspot.com. See Trader Disclosure.
Trade at your own risk. The blog site, Newsletter and all other information, material and content accessible from this Site (collectively, the "Content") provided herein provides the context for market analysis with respect to a market's, a security or a commodity's general position utilizing the Elliott Wave Principle. The Content contained herein are the opinion and general comments of the author and is based upon information that Mr. Sinibaldi considers reliable but neither ElliottWaveLive nor he warrants it's completeness or accuracy and it should not be relied upon as such. Mr. Sinibaldi or ElliottWaveLive (collectively, referred to as “EWL”) are not under any obligation to update or correct any content provided on this website. Any statements and or opinions are subject to change without notice. The content and comments contained herein neither purports nor intends to be, specific trading advice. It has been prepared without regard to any particular person's investment objectives, financial situation and particular needs. Information should not be considered as an offer or enticement to buy, sell or trade.
A more and comprehensive Risk Disclaimer and Disclosure Statements is available within the left margin of this blogsite.
======================================================================
Fair Disclosure Notice: I do not have a position in any of the aforementioned futures markets or securities related to this article.


