Showing posts with label CRB Index. Show all posts

Monday, September 17, 2012

A Possible Explanation for Commodities Sell off


I wanted to make a quick intra-day post for readers who might be scratching their head regarding the sell off in commodities. 

I've been tracking this wave count at the monthly chart level and as of Friday's close, the index closed right at resistance. I have not had an opportunity to label the subdivisions of the rise from w.1 circle low but given the across the board decline in commodities a closer look is warranted. 


Best of Trading

======================================================================
ElliottwaveLive is not an investment advisory service or broker dealer. None of its contributors are registered investment advisors, licensed stock brokers or CTA's. The author may hold short term and long term positions in the futures, stocks and ETF's discussed herein. The author may also trade around those positions which may be in direct conflict with your positions. Complete trade disclosures of the contributor’s holdings are posted at www.elliottwavelive.blogspot.com. See Trader Disclosure. 

Trade at your own risk. The blog site, Newsletter and all other information, material and content accessible from this Site (collectively, the "Content")  provided herein provides the context for market analysis with respect to a market's, a security or a commodity's general position utilizing the Elliott Wave Principle. The Content contained herein are the opinion and general comments of the author and is based upon information that Mr. Sinibaldi considers reliable but neither ElliottWaveLive nor he warrants it's completeness or accuracy and it should not be relied upon as such. Mr. Sinibaldi or ElliottWaveLive (collectively, referred to as “EWL”) are not under any obligation to update or correct any content provided on this website. Any statements and or opinions are subject to change without notice. The content and comments contained herein neither purports nor intends to be, specific trading advice. It has been prepared without regard to any particular person's investment objectives, financial situation and particular needs. Information should not be considered as an offer or enticement to buy, sell or trade. 

A more and comprehensive Risk Disclaimer and Disclosure Statements is available within the left margin of this blog site.   


======================================================================
Fair Disclosure Notice: I do not have a position in any of the aforementioned futures markets or securities related to this article. 


Sunday, June 3, 2012

You Decide The Fate of the Markets

Richard Russell stated in his newsletter, “I believe that the bear signal is telling us that Greece will default, to be followed by Spain, and the whole Eurozone may then fall apart.I consider the April-May action to be a continuation of a primary bear market that started on October 9, 2007, with the Dow at 14,164.53.  We are now dealing with the latter part of the primary bear market that began in 2007.”

While I don't subscribe to the newsletter, I did find myself in agreement with the quote. Everybody that follows me knows that I'm a long term bear and my view hasn't changed. It's lonely taking a contrarian view, especially with thinly traded markets and the manipulation of markets by the FED. Does it concern me that the FED may never stop printing and my shorts may get blown out? Certainly, but surely most readers would agree that the results of massive stimulus around the world hasn't really solved most macro problems. While QE1 and QE2 and Operation Twist has been supportive to US markets... each  has failed to push the broader market to new highs. Europe is in full crisis mode that threatens to take down global markets like dominos. China exports the majority of their goods to Europe. Australia is highly dependent on China for material purchase. Pundits say the  US is isolated from the Euro contagion. I ask how, since industrial multinational earnings will surely miss.

I wanted to briefly share what I'm looking at. Just charts... not allot of detailed commentary..... for you to evaluate. Enjoy

DOW


Dow upper resistance trendline holding yet I'm watching for the possibility that the same fractal pattern as shown in the shaded box may play out leading to another major advance. 


CRB Index


Working cycle w. III with much further downside risk. If equities experience a similar fate as last summer, commodities should continue their decline (See US Dollar, all in one chart.)


US Dollar


The Dollar has been building a base that supports the overall decline of commodities.


S&P vs CRB (All In One)


Notice commodities declined after each equity peak. However, as the the wave count of the CRB chart (above) indicates, a major top is in and explains why commodities continue their decline while equities were able to make a modest recovery highs.


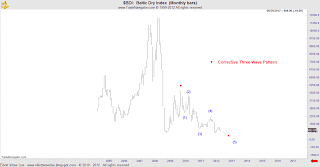
Baltic Dry Index


VIX


The VIX is making a rounded bottom and I expect allot of volatility as price works up the lower right side of the arc. The H&S pattern is only the beginning. This view would be consistent with a more serious decline in equities. 


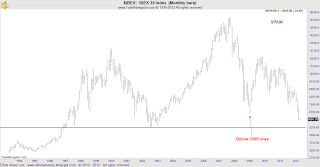
EUROPE


Tuesday, June 14, 2011

Chart of The Day: $AUD-USD


At the monthly chart level, the $AUD-USD appears to have completed Grand Supercycle w.IV where the internal structure breaks down in a w.(c) = w.(a) at 1.1086 relationship. A loss of .9705 would confirm that the top is in, clearing the way for a massive impulsive move to the downside.


This view aligns commodity currencies, like the Aussie Dollar,  to the recent strength in the USD (not shown) and the most recent weakness in the CRB Index.


Australia is a large exporter of gold, copper and wheat  and there is a high degree of correlation between the AUD and these markets. With the wave count calling for a decline in the currency against the USD, one would expect that the price of correlated markets to also decline. Needless to say, each of the corresponding commodity charts are bearish.