Showing posts with label Elliott. Show all posts

Monday, December 24, 2012

Coffee: Nearing An Inflection Point ?

Coffee To Rally in 2013?


It seems like an eternity but Coffee may be nearing an important inflection point that should lead to a significant counter trend rally!

I've been following the decline in coffee since May 2011 and posted my trade plan for this market.


Since that time, price has continued to grind lower.  I've listed two downside targets that represent where:  w.5= w.1 at 114.65 and w.5 = .618{w.1-w.3} at 95.05. Also not that the previous 4th, at one lesser degree, a common elliott support zone is right in this area.


Dropping to the weekly level, we can see that the minimal requirements for a completed w.5 circle has already been met i.e. price has made a new low below w.3, yet the two downside targets at the monthly level are still possible. 

Not shown, MOMO indicators exhibit bullish divergence but my suspicion is that we need to make at least another low. 

If you trade coffee it's time to watch price action closely. 2013 main bring significant gains! 


Best of Trading


======================================================================
ElliottwaveLive is not an investment advisory service or broker dealer. None of its contributors are registered investment advisors, licensed stock brokers or CTA's. The author may hold short term and long term positions in the futures, stocks and ETF's discussed herein. The author may also trade around those positions which may be in direct conflict with your positions. Complete trade disclosures of the contributor’s holdings are posted at www.elliottwavelive.blogspot.com. See Trader Disclosure. 

Trade at your own risk. The blog site, Newsletter and all other information, material and content accessible from this Site (collectively, the "Content")  provided herein provides the context for market analysis with respect to a market's, a security or a commodity's general position utilizing the Elliott Wave Principle. The Content contained herein are the opinion and general comments of the author and is based upon information that Mr. Sinibaldi considers reliable but neither ElliottWaveLive nor he warrants it's completeness or accuracy and it should not be relied upon as such. Mr. Sinibaldi or ElliottWaveLive (collectively, referred to as “EWL”) are not under any obligation to update or correct any content provided on this website. Any statements and or opinions are subject to change without notice. The content and comments contained herein neither purports nor intends to be, specific trading advice. It has been prepared without regard to any particular person's investment objectives, financial situation and particular needs. Information should not be considered as an offer or enticement to buy, sell or trade. 

A more and comprehensive Risk Disclaimer and Disclosure Statements is available within the left margin of this blogsite.   
======================================================================

Fair Disclosure Notice: I do not have a position in any of the aforementioned futures markets or securities related to this article. 

Wednesday, November 7, 2012

Gold: A Critical Juncture


The weekly chart provides my preferred and alternate wave labels as well as the equivalent 10 and 40 week sma's (50-sma and 200-sma day equiv.) . Also of key interest to me is is that the trendline from 4/2009 continues to be probed and supportive of this market. As such, it is in my opinion that, while I haven't provided any bearish wave count, a failure of non elliott technicals , such as a break of the trendline and 40-week sma, could initially draw price to where w.(3) = 1.618 w.(1) at 1344.3.  


In addition, I showed this chart on Oct 19, 2012 and the cyclic turn of 11 and 22 months. Read the initial post

The October high may be MONEY given the elliott work that I have provided. If so, Gold Bulls are about to be ambushed. 

Let's See what Happens. 


Best of Trading


======================================================================
ElliottwaveLive is not an investment advisory service or broker dealer. None of its contributors are registered investment advisors, licensed stock brokers or CTA's. The author may hold short term and long term positions in the futures, stocks and ETF's discussed herein. The author may also trade around those positions which may be in direct conflict with your positions. Complete trade disclosures of the contributor’s holdings are posted at www.elliottwavelive.blogspot.com. See Trader Disclosure. 

Trade at your own risk. The blog site, Newsletter and all other information, material and content accessible from this Site (collectively, the "Content")  provided herein provides the context for market analysis with respect to a market's, a security or a commodity's general position utilizing the Elliott Wave Principle. The Content contained herein are the opinion and general comments of the author and is based upon information that Mr. Sinibaldi considers reliable but neither ElliottWaveLive nor he warrants it's completeness or accuracy and it should not be relied upon as such. Mr. Sinibaldi or ElliottWaveLive (collectively, referred to as “EWL”) are not under any obligation to update or correct any content provided on this website. Any statements and or opinions are subject to change without notice. The content and comments contained herein neither purports nor intends to be, specific trading advice. It has been prepared without regard to any particular person's investment objectives, financial situation and particular needs. Information should not be considered as an offer or enticement to buy, sell or trade. 

A more and comprehensive Risk Disclaimer and Disclosure Statements is available within the left margin of this blogsite.   
======================================================================

Fair Disclosure Notice: I do not have a position in any of the aforementioned futures markets or securities related to this article.


Friday, September 16, 2011

Before the Bell: More Manipulation of Markets

Announcements:

As a result of my ongoing efforts to build my new website, some readers may have noticed that my intraday Tweets and content posting has been cut back to just M-W-F. I appreciate your understanding and patience.

When my schedule permits, I will make every effort to follow the market intraday and make blog entries.


The Emini S&P:

Here's a quote I read from the Associated Press, "Global stocks remained buoyed by the decision of five top central banks to provide unlimited amounts of dollar loans to the banking sector, easing one of the concerns driving the recent turbulence in financial markets of late."

While this persistent manipulation is frustrating in that it blows up short term wave counts.... it doesn't change the larger degree bearish view.


In Wednesday's Market Pulse, I features two existing elliott wave counts, of which the chart above was invalidated  on a break above 1199.75.

However, as in any corrective structure, there are still multiple ways of labeling the structure and often the count is unclear, sometimes until it's complete. This is why attempting to trade a complex structure can be hazardous to your account.

In this weeks edition of Heard on the Street , I'll be showing how the intraday price action still fits within the larger degree bear trend. Until then....


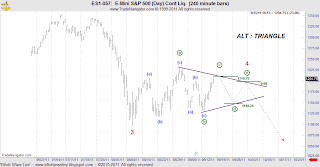
... here is the other interpretation, the contracting triangle. Notice how I was looking for a decline yesterday that never materialized and the wave structure continued to subdivide. Thanks Central Bankers!


Here is the updated chart through yesterdays close. The ideal target remains where w.c circle = .618 w.a circle at 1210.75.

Technicals already show divergence therefore the wave structure at this juncture is mature. Let's see how the lower intraday time frames look at the open.


Best of Trading

Tuesday, September 6, 2011

Before the Bell: Updated $ES_F Chart


At the 120 minute chart level, price has challenged the lower boundary of the corrective price channel. If this interpretation is correct, a decisive break will occur that draws prices to new lows.


And here is my current elliott wave count for the decline that began at 1229.75.  I'm giving this count some wiggle room as there are other ways to count this (see ALT) but I believe that the triangle w.4 red breaks up the subdivision of w.(3) well. The depth of the counter-trend rally that is currently taking place should confirm the count. If correct, I do not expect price to print above the .50 retracement level. Should price make a much deeper retracement, but not exceed 1207.5 (the invalidation point for the overall interpretation), then most likely the ALT count is correct.


Let's see what develops.


Best of Trading

Friday, August 12, 2011

Chart of the Day: Using Elliott Wave in Real Time

A recent call illustrates the benefits of using the Elliott Wave Principle to manage trades. Watch this video as I go over the trade plan, the trade set up, and real time application of elliott wave.


Best of Trading


Sunday, August 7, 2011

Heard On The Street : Panic and Chaos

ATTENTION: New readers and loyal subscribers....

...Imagine the chaos and panic that may hit world markets --
 then decide how you'll protect your money on Monday...


Traders,

The past week has certainly been challenging to say the least and after the S&P downgraded U.S. debt, any glimmer of hope that traders had at Friday's close may evaporate.

What if the market is unable to catch a bid come Monday morning? Watching the market free fall without a plan to protect yourself won't be fun. After all, most portfolios haven't recovered since 2007 and the losses could be much greater this time around.

Since my July 17, 2011 call , I’ve been warning readers that the end of the bear market counter-trend rally was coming. In fact, my 2007-2011 analogy of the emini S&P demonstrated the fractal nature of the market, how the pattern would progress and the targets associated with the call. In fact, I've sent out multiple updates on Twitter and through my Monday- Wednesday-Friday blog posts keeping you abreast of the markets. 

I'm guessing that subscribers like you either protected yourself from the market's recent carnage or were already prepared to discuss it with your investment advisor and take advantage of it as a result of my forecasts ...

... but if my forecast didn't raise your eyebrows because you don't realize the benefits of Elliott Wave Analysis I can only hope that the events of this past week will change your mind.

Thursday’s 512 point Dow and 60 point S&P loss was just part the beginning, not the end. And if you are a bull, the losses you’ve taken so far could get much, much worse. 

What if you had know in advance, like my readers, that my target level for the S&P was 1166? What if you had that number in your pocket since the July 30, 2011 call and that the level was briefly surpassed on 8/4/2011 before staging a minor reversal.

It’s not too late for you to realize the educational benefits that I provide and the power of the Elliott Wave Principle. Sitting on your hands and waiting for the Central Banks around the world to come up with another ingenious plan is the worst move you could make.


Introducing Signal Watch RT  ® -- a premium service -- providing insightful, real - time intraday elliott wave analysis


There's one request that I've heard from readers again and again and that's more live, hands - on real-time wave analysis. Now if that sounds like something you might want to hear more about, Signal Watch RT ®, may be the solution you're looking for. You'll know what the market is likely to do and when it is likely to do it.

Next month, watch for a complete list of features and benefits and pricing but today I want to thank you personally for joining our community of  Elliott Wave Live readers. Roll up your sleeves, lock the door behind you, watch the video below NOW, then peruse my achieves (lower bottom right fold) and join my blog if you agree that my work is insightful.
Best of Trading,

Mike Sinibaldi 


Friday, August 5, 2011

Before The Bell: $ES_F


Today's positive Non Farm Payroll data has lead to the following price movement. My labeling shows  how I am viewing the move.

Price has reached the 1.618 extension that is typically the limit for any corrective move UNLESS a complex correction develops. I have no way of determining this at this juncture. If a simple a-b-c took place, then we should not see a new high and the move will be fully retraced.

Conversely, we must be aware that the market is severely oversold, that I can identify divergence and that a larger rally should be in order that moves prices much higher than current levels.

Note : A break of 1202 confirms a corrective wave interpretation ... not the resumption of the bull trend.

Best of Trading