Showing posts with label Emini SP Futures. Show all posts

Friday, September 16, 2011

Before the Bell: More Manipulation of Markets

Announcements:

As a result of my ongoing efforts to build my new website, some readers may have noticed that my intraday Tweets and content posting has been cut back to just M-W-F. I appreciate your understanding and patience.

When my schedule permits, I will make every effort to follow the market intraday and make blog entries.


The Emini S&P:

Here's a quote I read from the Associated Press, "Global stocks remained buoyed by the decision of five top central banks to provide unlimited amounts of dollar loans to the banking sector, easing one of the concerns driving the recent turbulence in financial markets of late."

While this persistent manipulation is frustrating in that it blows up short term wave counts.... it doesn't change the larger degree bearish view.


In Wednesday's Market Pulse, I features two existing elliott wave counts, of which the chart above was invalidated  on a break above 1199.75.

However, as in any corrective structure, there are still multiple ways of labeling the structure and often the count is unclear, sometimes until it's complete. This is why attempting to trade a complex structure can be hazardous to your account.

In this weeks edition of Heard on the Street , I'll be showing how the intraday price action still fits within the larger degree bear trend. Until then....


... here is the other interpretation, the contracting triangle. Notice how I was looking for a decline yesterday that never materialized and the wave structure continued to subdivide. Thanks Central Bankers!


Here is the updated chart through yesterdays close. The ideal target remains where w.c circle = .618 w.a circle at 1210.75.

Technicals already show divergence therefore the wave structure at this juncture is mature. Let's see how the lower intraday time frames look at the open.


Best of Trading

Wednesday, August 31, 2011

The Market Pulse


Consistent with Monday's call and the Before the Bell updated intraday chart presented on Tuesday, the emini SP retraced to 1192.5 and has now reached the 1227-28 target zone. With several Fibonacci levels and wave relationships clustered around today's high, as well as supporting technicals, it is possible to consider the advance from 1097 complete. However, the rise from 1192.5 doesn't count well and therefore I need to confirmation that a tradeable top is in place.


Looking at the 7200 tick chart of the September contract, I can argue that we have five waves complete from the top thus supporting my conclusions but I'd like to see a break of 1192.75 on the 60 min, daily session chart, to bolster the interpretation.

Any remaining bullish view clings to a break above today's high of 1229.75.

Let's see what happens.

Best of Trading

Monday, August 22, 2011

The Market Pulse


At the 240 min chart level I an hesitant to label w(ii) complete due to the fact that the market could not even reach the .382 retracement of w.(i).


Also from a time perspective, the minimum time relationship for a corrective sequence is .382. As you can see, the w.(ii) completion feel short of this requirement. As such, I'm going remain neutral until the emini SP and look for the following:


Bearish

The w.iv circle top has yet to be confirmed by a break of 1103. If w.(ii) is indeed complete, we should see a break of this level as well as a break of the lower boundary of the channel... confirming third wave price action. If both occur, then look for the levels stated in my weekend edition of Heard on the Street as potential targets for the termination of w.v circe.

 
Bullish

A print above today's high of 1146.5 would confirm my suspicion that w.(ii) wasn't complete and that a larger corrective structure was unfolding.


Best of Trading

Friday, July 22, 2011

$ES-F: 2007-2011 Analogy Update


Attached is the updated chart for the Emini S&P futures. My initial chart and analysis can be found in the July 17, 2011 edition of Heard On The Street.

I've updated the chart up though this weeks close and will discuss all the scenarios and implications at further length in this weekends video. While I can't be certain to any outcome, the chart has got my full attention... as it did the first time I noticed the similarities. What's interesting is that after next Friday's close (7/29/2011), there will only be 1 trading day left before the U.S. must extend the debt ceiling or it runs out of money to pay it's debt. Would the Market's reaction be what the chart forewarns?

Just something to ponder while we see how the market closes today.

Best of Trading

Monday, June 20, 2011

The Market Pulse

Tonight's commentary will be brief as the S&P is following the comments made in this weekend's edition of Heard On The Street quite well.


As a quick reminder, I'm looking for w.4 to terminate at 1288 and today's price action was a step in the right direction.


This 3600 tick chart was presented over the weekend to show the subdivisions of w.4 in which I thought w.b was complete but said that I would need to see price move beyond 1270 to have absolute confirmation that w.b had ended.  As you can see the market made another low in what was probably w. z of a triple zig-zag (not labeled) to complete w.b at 1256.25.


At the 240 minute chart level, w.c is underway and w.c = w.a at 1284 which is shy of our initial target of 1288. The .382 retracement level of 1281.75 closes the gap and is a level of agreement (see chart below).


For tomorrow, continue to look up and watch price action surrounding 1281.75.

Best of Trading

Saturday, June 18, 2011

Head On The Street: #USD, $ES-F, #CrudeOil

The Market's are certainly more volatile. In the coming weeks we'll know whether the most recent declines are corrective or the resumption of the Bear Market. In the meantime, find out where Crude Oil, the USD and the S & P are headed.


Monday, June 13, 2011

Heard On The Street

ANNOUNCEMENTS:

  1. You'll notice a few changes to my video productions. I'll be adding a table of contents so that readers have the choice of either viewing the entire video or select specific areas of interest.
  2. I'd like to thank everyone who provided feedback on my blog. Of those comments, here are a few requests that I would explore further.
  • Several readers have asked for more intraday forecasts of the ES futures market's direction. What other Markets would you be interested in receiving on an intraday basis?

  • What is the best method of providing intraday forecasts? Flash Alert or Live Trading Room?

Please comment directly to this feed if you have a google account or send a Twitter direct message to @elliottwavelive .


========================================================================

THE MARKETS:

The broader US indices have decline for six straight weeks. News headlines have quickly soured and concerns about a global growth slowdown remain. The Nasdaq and the Russell 2000 both turned negative for the year and there's just not buying interest at this point.

The question remains... are we witnessing a correction or an escalating situation that could lead to another crippling economic downturn? To find out, watch this weeks video edition of Heard On The Street.

Tuesday, June 7, 2011

ES-F: Intraday Update


here is the updated 3600 tick chart with typical Fibonacci extensions for w.C circle terminal of w. iv circle....


and the updated 240 min chart level. Bias remains targeting the .382 level for a possible turn lower.

Best of Trading


Sunday, June 5, 2011

Heard On The Street

ANNOUNCEMENTS

I'd like to ask my readership for a bit of advice. In July 2010, I started blogging with a focus on the emini S&P. My analysis now follow numerous Market's around the world and I would like to know if there are any particular market's of interest that you would like me to discuss more frequently or begin coverage of. Also, today's daily and weekly commentary are vastly different in the fact that the body of work is much more detailed as well as utilizes video. I would greatly appreciate it if I could get some suggestions as to how to improve the blog or what changes you would like to see that can add value. For those who are interested e-mail me at mikesinibaldi@yahoo.com or DM me at @elliottwavelive on Twitter.

Watch my weekly video wrap up where I'll be covering the emini S&P, the EUR-USD, Crude Oil and the FTSE 100.

Best of Trading


Tuesday, May 31, 2011

Heard On The Street

ANNOUNCEMENTS:

Moving forward, the weekly edition of Heard on the Street will focus on the monthly, weekly and daily perspectives, while my M-W-F edition of The Market Pulse will focus on the daily, 240 minute and lower time frame perspectives. In doing so, the weekly recap will cover more markets and detailed discussion regarding the larger trend in each market.

IS THE RISK TRADE STILL ON?

The last high that the market made was almost one month ago and up until Wednesday of last week, the market had lost 71.25 points. The wave pattern remains open for interpretation but favors a sideways to down bias. Learn what to expect by watching this weeks video edition of Heard On the Street where I'll cover the Emini S&P, Copper and the EUR-USD.


Sunday, May 22, 2011

Heard On The Street

Announcement:

This weeks edition of Heard On The Street will not include a video as I had to travel over the weekend.


Identifying, the wave pattern in the $ES_F remains challenging and the market refuses to show it's had. Until it does, all we can do is focus on one wave at a time until enough data enables the wave structure to be clearly identified.


As of the close, my best interpretation remains an expanding diagonal. If you have been reading my posts you know that the pattern has flaws. See last Wednesday's blog post for details. As of the close of Friday's trade, the weekly chart level shows the current wave labeling. Notice this week's price bar , called a "spinning top" to candlestick traders. The small real body shows that neither the bulls or bears were able to gain control. The implication is that a spinning top immediately proceeds trend losing momentum.  If this was the case we would expect a move up for the early part of next week.


The above chart shows the bullish expectations, given the spinning top at the weekly chart level. However, when I look at Friday's session, I see weakness as price closed near the lows of the session. Add your favorite momentum indicator and you will see trending momentum to the downside that contradicts the weekly implications of the spinning top. RSI is currently 44.66 and hasn't broken the 40 level which would imply that a larger decline was unfolding.  Also note that the decline from w.iii circle has been contained within a corrective price channel; is choppy and that four waves have been completed within it. The structure SHOULD be viewed as corrective.


Ok, corrections can't end in four waves so here's what I think will unfold under a near term bearish scenario. I've only labeled the waves from w.4 red low but I want you to focus only on what unfolds from 1367.25 high. If a double zig-zag unfolds as I have indicated, then I'm looking for w.(a) of w.z to terminate near 1318.25- 1317.75 for tomorrow's trade that will be followed by w.(b) up and a final round of selling to where w.z = w.w at 1294.25. Note nearby structural support of 1290.25 and the .618 retracement of 1290.50 are nearby.

In conclusion, I've given a bulls and bearish view. What should be exciting to you if you are a bull is that we know that eventually the market will make a new recovery high under either view. Only a loss of 1290.50 would imply that a more significant decline was underway and that a more aggressive bearish posture would be adopted.

I hope you found this information helpful and best of trading.

Sunday, May 15, 2011

Heard On The Street

The Emini SP future's most recent price action is perplexing. As of Friday's close, the Elliott wave pattern and count is unclear. Watch this brief video to find out how I approach a market when my wave interpretations don't match a high number of rules and guidelines.

Wednesday, May 11, 2011

$ES_F: Updated Chart


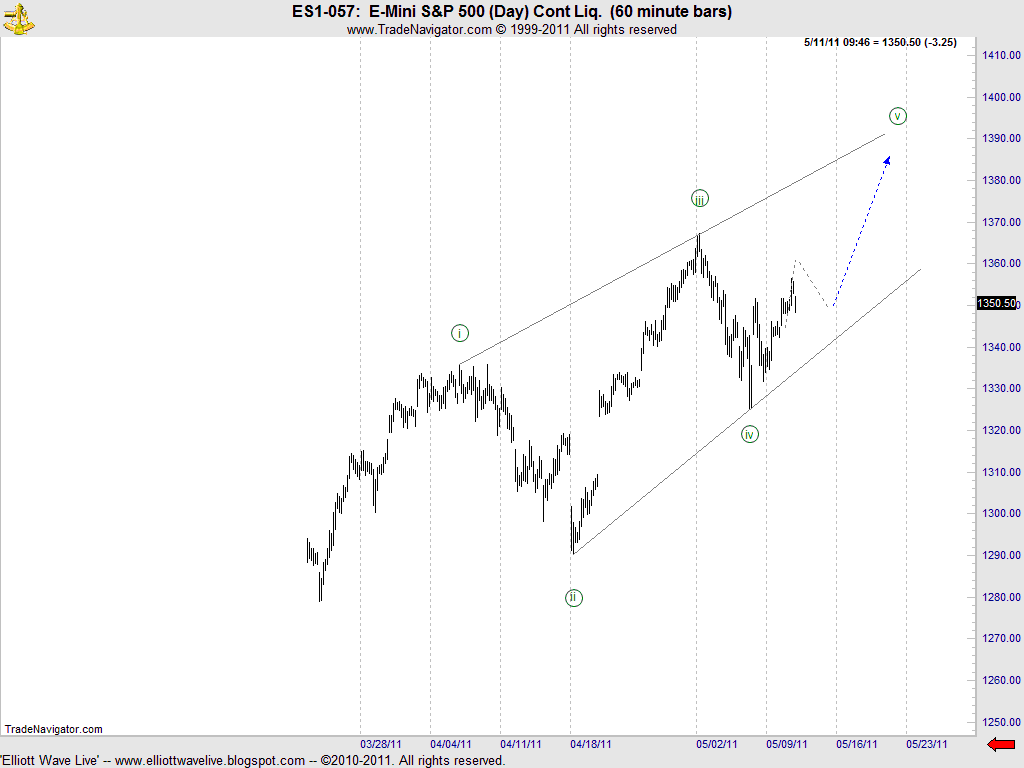
The last time we spoke about the ES_F, I left readers with an ending diagonal interpretation where w.iv circle had completed and I was looking for an up down up sequence to complete the pattern. Above is the chart. Notice that price did push higher.


 At the 240 min chart level of the front month contract, the overnight session pushed to where w.(c) = w.(a ) to complete w.a circle at 1358.25. I'm looking for an initial decline to the target box that represents 1343.50 - 1345.75, that will be followed by a three wave countertrend move, then a final round of selling to the .618 retracement of 1325.25 to 1358.25.  As soon as w.(a) of this initial decline has completed, additional fib termination points will be provided and discussed.

Best of Trading


Sunday, May 8, 2011

Heard on The Street: $ES_F $DX_F $EUR_USD #Crb Index #Commodities #FX

Three Pressing Questions that YOU Might Be Asking

  • Commodities had a terrible week. Is the trend over or is the Market just offering another lower entry point?

  • Has the long awaited turn in the USD arrived or was the past weeks price action just another fake out? 

  • Will "Sell In May and Go Away Theory" lead to a substantial correction?

Watch this video edition of Heard On The Street for the answers you seek and gain insight into where each market may be headed.


Wednesday, April 27, 2011

The Market Pulse


The S&P Index rally remains intact as Helicopter Ben didn't disappoint. Even though a new recovery high was reached, the move was anticipated by the corrective RSI signature I spoke of in my 4/20/2011 daily commentary

RSI has pushed through 60, the area where bear rallies end. ROC has also crossed the zero line, another bullish signature. 


Here is the updated weekly chart ... the bullish count. Today, 1346.25 stubbornly gave way leaving other potential targets in play.  Keep in mind that any meaningful advance above 1381 negates the bearish view where w.4 would still unfold in a running triangle (not shown).

For tomorrow, price has limited upside potential as the upper Trendline of the Detrend Osc. should provide resistance.


Turning our attention to the 30 minute chart level, the subdivisions of w.5 are unfolding. By the close, price had met a logical price objective were w.(v) of w.5 = .618{w.(i)-(iii)} yet the final subdivisions appear to need one more push up to complete the count.

Let's see what develops tomorrow.

Best of Trading


Monday, April 25, 2011

The Market Pulse

Today's session in the ES_F was a snorer at best. With the FED decision regarding interest rates due on Wednesday, participation will most likely remain on the lighter side. Materially, nothing has changed from the short term forecast provided within the April 24, 2011 edition of Heard On The Street. Therefore, I thought I would spend some time on Gold.


At the weekly chart level, Gold's rally is very mature with 1530 as a target for the termination of w.5.


At the daily chart level, w.(i) - w.(iii) of w.(v) of w.5 are complete and I'm calling for a modest decline to where w.(iv) =.382w.(iii) at 1491 before making a final push to 1530.


Best of Trading

Monday, April 11, 2011

The Market Pulse

Announcements

I'd like to thank everyone for their patience as I spend the weekend re-installing my computer's operating system and couldn't produce the weekly edition of Heard On The Street. In an attempt to catch up, tonight's update will contain the charts of other markets as well as the S&P but will not contain much of commentary.

S&P


BULLISH


The previous three charts show the bullish scenario and termination point of w.(C) at 1346.25 or 1381.5 or at the .786 retracement of 1389.75. At the 60 min chart level, w.iv circle is unfolding in a double three with Fibonacci support surrounding 1314.25-1314.


BEARISH


OIL


Oil has completed w.(3) and w.(4) should unfold as a sharp correction according to the principle of alternation, i.e. as w.(2) was sideways expanded flat. The market should should find support at the .236 or .382 retracement of w.(3).... the most common of .382 that also corresponds to the previous fourth wave of one lesser degree.


GOLD


Best of Trading


Sunday, April 3, 2011

Heard On The Street

In this weeks video edition of Heard On The Street, I'll be reviewing the monthly and daily charts of ES_F and $SPX as well as revisiting the chart of the Gold/Oil Ratio.

Enjoy.

Sunday, March 27, 2011

Heard On The Street

The wave pattern in the e-mini S&P's is still not resolved but the bearish view appears to be in trouble as time and price relationships must quickly be met or the bulls remain in control of  this market.

View my bullish and bearish wave counts as well as an update on the EURO-USD in this weeks video edition of Heard On The Street.


Best of Trading

Wednesday, March 9, 2011

The Market Pulse: NASDAQ and S&P

The Market has virtually no net gain or loss since March 2, 2011. By now every trader has their eyes on what appears to be a triangle pattern. With tomorrow's jobs report, traders may finally push the market in the direction of the "new" near term trend. So look for some volatility tomorrow.


Earlier today I tweeted that the NASDAQ was the weakest of the indices. I think it's important to cover this market since the greater possibility exists that the NASDAQ may lead the other markets down. Price has tested the 50-sma on five occasions. A print below 230625 would have further bearish implications, yet support is lurking just below the market at 2303 and 2281 - 2282. I wouldn't doubt that a stop running exercise will unfold. Should any sell off have substance, my near term target is 2258.


Turning my attention to the ES_F market, you can see that the market is yet to challenge the 50-sma and price is oscillating along the lower elliott channel line. As a reminder, a significant break of this line on a closing basis and a print below 130275 would negate any idea that a triangle was unfolding. Keep in mind that the March contract expires so the equivalent in the June contract is 129825.


If the wave structure is a triangle fourth wave, then w.e circle may have been struck at 1312.27 that was  followed by a minor five wave advance and as of the close... a choppy second wave is developing. This interpretation would be confirmed with a print above 1325.74. Thereafter, price will make a new recovery high to beyond 1344.07 in the $SPX and 1343 in the ES_F.

In conclusion, tomorrows trade centers around 1325.74 (bullish) and 130275 (bearish) in the continuous contract or the equivalent in the June contract is 129825 (bearish).


I hope you found this information helpful.

Best Of Trading