Every Friday I dedicate my day to working in a Trading Lab to either developing new trading ideas or enhancing an existing trading strategy. This weeks trading lesson is based upon two hypothetical trades that I made during Friday's session and focuses on accurately analyzing MACD divergences and how the indicator can be used to confirm your elliott wave analysis.
Numerous professional traders dispel the use of divergence analysis but as you will see, when used to compliment your elliott wave analysis, divergences can help confirm your count and assist in determining market tops and bottoms.
I hope the examples contained within the following video will encourage you to do your own analysis and become confident to act on divergence analysis.
Best of Trading
Showing posts with label divergence. Show all posts
Showing posts with label divergence. Show all posts
Sunday, October 23, 2011


Wednesday, October 5, 2011
The Market Pulse

Here is the 20 min chart that I left readers in last nights FLASH ALERT. As you can see, the market made a .236 retracement of w.(iii) and has advanced just past the upper fib target of 1137.75.

I've updated the wave labels through today's close. Notice that I've added an additional fib level of 1141.5. Given that price nearly tagged this level, the slope of w.(v), diverging momentum (not shown) and weaker internals.... odds are high that this sequence is complete.
For the ON session or in tomorrow's trade, the count suggest that a w.(b) will unfold in three waves. Prints below the w.(iv) low of 1109.5 would provide the initial evidence to call w.(a) complete while prints above 1141.25 would negate.
As a reminder, I'm not sold on the fact that 1068 is the LOW and the price action is sloppy from 1229.75. Needles to say... I'm watching this market very carefully.
Let's leave it there for tonight and ...
Best of Trading
Friday, September 16, 2011
Before the Bell: More Manipulation of Markets
Announcements:
As a result of my ongoing efforts to build my new website, some readers may have noticed that my intraday Tweets and content posting has been cut back to just M-W-F. I appreciate your understanding and patience.
When my schedule permits, I will make every effort to follow the market intraday and make blog entries.
The Emini S&P:
Here's a quote I read from the Associated Press, "Global stocks remained buoyed by the decision of five top central banks to provide unlimited amounts of dollar loans to the banking sector, easing one of the concerns driving the recent turbulence in financial markets of late."
While this persistent manipulation is frustrating in that it blows up short term wave counts.... it doesn't change the larger degree bearish view.

In Wednesday's Market Pulse, I features two existing elliott wave counts, of which the chart above was invalidated on a break above 1199.75.
However, as in any corrective structure, there are still multiple ways of labeling the structure and often the count is unclear, sometimes until it's complete. This is why attempting to trade a complex structure can be hazardous to your account.
In this weeks edition of Heard on the Street , I'll be showing how the intraday price action still fits within the larger degree bear trend. Until then....

... here is the other interpretation, the contracting triangle. Notice how I was looking for a decline yesterday that never materialized and the wave structure continued to subdivide. Thanks Central Bankers!
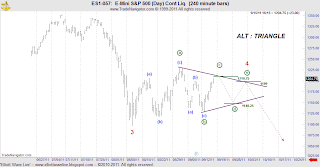
Here is the updated chart through yesterdays close. The ideal target remains where w.c circle = .618 w.a circle at 1210.75.
Technicals already show divergence therefore the wave structure at this juncture is mature. Let's see how the lower intraday time frames look at the open.
Best of Trading
As a result of my ongoing efforts to build my new website, some readers may have noticed that my intraday Tweets and content posting has been cut back to just M-W-F. I appreciate your understanding and patience.
When my schedule permits, I will make every effort to follow the market intraday and make blog entries.
The Emini S&P:
Here's a quote I read from the Associated Press, "Global stocks remained buoyed by the decision of five top central banks to provide unlimited amounts of dollar loans to the banking sector, easing one of the concerns driving the recent turbulence in financial markets of late."
While this persistent manipulation is frustrating in that it blows up short term wave counts.... it doesn't change the larger degree bearish view.

In Wednesday's Market Pulse, I features two existing elliott wave counts, of which the chart above was invalidated on a break above 1199.75.
However, as in any corrective structure, there are still multiple ways of labeling the structure and often the count is unclear, sometimes until it's complete. This is why attempting to trade a complex structure can be hazardous to your account.
In this weeks edition of Heard on the Street , I'll be showing how the intraday price action still fits within the larger degree bear trend. Until then....

... here is the other interpretation, the contracting triangle. Notice how I was looking for a decline yesterday that never materialized and the wave structure continued to subdivide. Thanks Central Bankers!

Here is the updated chart through yesterdays close. The ideal target remains where w.c circle = .618 w.a circle at 1210.75.
Technicals already show divergence therefore the wave structure at this juncture is mature. Let's see how the lower intraday time frames look at the open.
Best of Trading
Wednesday, August 24, 2011
Is It Finally Time for Natural Gas to Shine?
I've Pulled The Trigger and
Bought Natural Gas Today...


At the daily chart level, from the 3.85 low, I was looking for a five wave advance to confirm the weekly interpretation. If correct, price should thrust from the w.e low. Two sets of technicals are supportive of my analysis. The MACD shows divergence as prices made new lows and the RSI broke through 50-60 levels on the rally to 4.02 signaling that the rise was most likely not a counter trend move.
Subsequent price action is in a three wave zig-zag and the market has found support at the .618 retracement of w.i. I level.
Trading the futures in Natural Gas is too my for my blood so I prefer using the ETF, ticker symbol UNG .

As to properly disclose to my readers, THIS IS A REAL TRADE, NOT SIMULATED! I will be adding ticker symbol UNG to my trade disclosure. You can locate that disclosure about 3/4 of the way down on the left hand margin of the site.
I've indicated my entry which front ran larger orders at 9.93 and the figure where w.(c) = w.(a) of 9.84 which is a reasonable entry level. Risk on the trade is minimal (.24) per 100 shrs. I'll be watching how price reacts off 9.84, unless the structure of w.ii is already completed. My target is a challenge of the 10.14 with much higher potential.
Should price decline from 10.14 and in a five wave move, the analysis is flawed and so is the trade. As such, from a risk management view, I'd be looking to cover on the next three wave rally up.
If you are interested in following the trade, I'll be making regular comments to this post.
Let's see if I can make some coin.
Best of Trading
As always, following this trade is strictly for educational purposes! Please familiarize yourself with the Risk Disclaimer and Disclosure Statements make within this blog site.
Thursday, August 4, 2011
Silver:Revisited
Is There Still Silver In These Hills?

The following chart is part of my initial commentary on July 28, 2011. As you can see my analysis for the termination point of the corrective rally was incorrect as price exceeded my invalidation point of 41.97.

Here is the updated chart through today's close. From the w.iv circle low of 39.13, a small five wave advance where w.v = .382 w{i-iii} at 41.92 took place and is in agreement with the 1.618 RF extension of w.B red. Also note that the bearish reversal that occurred today is also what one wants to see if a top is in... i.e. a swift retracement of w.v in less time than it took to complete.

Additional evidence of a w.(2) crest can be found by looking at the MACD technical study that shows a divergence as noted by the green lines. This market should remain under selling pressure in the days to come.
Best of Trading
Subscribe to:
Posts (Atom)