Showing posts with label Emini Futures. Show all posts

Friday, September 16, 2011

Before the Bell: More Manipulation of Markets

Announcements:

As a result of my ongoing efforts to build my new website, some readers may have noticed that my intraday Tweets and content posting has been cut back to just M-W-F. I appreciate your understanding and patience.

When my schedule permits, I will make every effort to follow the market intraday and make blog entries.


The Emini S&P:

Here's a quote I read from the Associated Press, "Global stocks remained buoyed by the decision of five top central banks to provide unlimited amounts of dollar loans to the banking sector, easing one of the concerns driving the recent turbulence in financial markets of late."

While this persistent manipulation is frustrating in that it blows up short term wave counts.... it doesn't change the larger degree bearish view.


In Wednesday's Market Pulse, I features two existing elliott wave counts, of which the chart above was invalidated  on a break above 1199.75.

However, as in any corrective structure, there are still multiple ways of labeling the structure and often the count is unclear, sometimes until it's complete. This is why attempting to trade a complex structure can be hazardous to your account.

In this weeks edition of Heard on the Street , I'll be showing how the intraday price action still fits within the larger degree bear trend. Until then....


... here is the other interpretation, the contracting triangle. Notice how I was looking for a decline yesterday that never materialized and the wave structure continued to subdivide. Thanks Central Bankers!


Here is the updated chart through yesterdays close. The ideal target remains where w.c circle = .618 w.a circle at 1210.75.

Technicals already show divergence therefore the wave structure at this juncture is mature. Let's see how the lower intraday time frames look at the open.


Best of Trading

Sunday, August 14, 2011

Heard on the Street


Does a Recent Fibonacci Expansion Series
Confirm the Bear Market Return?


Announcements:

  • On August 20,2011 I will be releasing my Global Gains -- Mid Year Forecast covering 20 markets (World indices, Currencies, Energy, Commodities and Metals) as well as some key intermarket relationships that you should be watching.
  • In September, watch for details on my new premium service Signal Watch RT ® -- a premium service -- providing insightful, real - time intraday elliott wave analysis. A complete list of features, benefits and special discount pricing will be available for current Twitter followers.
  •  Not a Twitter fan? You can get my most recent blog posts quickly and easily by "following my blog" or subscribing to my RSS feed. See the top right portion of my blog for details.

 The Market:

The Emini SP continues to follow my 2007-2011 analogy. It's interesting to listen to and read the bull/bear debate from the talking heads and other pundits. I'll stick with the charts!

Listen to my weekend video -- Heard on the Street -- to gain unfair advantage over other traders during the upcoming trading week.

Best of Trading


Thursday, June 23, 2011

$ES-F: Updated Chart


Here is the updated chart per a readers request. Note the overlap of w.a has occurred based upon the globex session (see chart below). I've also noted the key area to watch for today of 1261.25 as well as the 200sma of 1261.75. Breaks below these levels would indicate that w. 4 was confirmed complete and that w.5 down is unfolding. Should 1261.25 hold, the possibility exists that a more complex correction for w.4 was still unfolding. SEE last night's Market Pulse for further details.


And here is the globex session showing that price has traded to 1263.25. Notice that the all session front contract has different levels of significance.


Best of Trading

Monday, June 6, 2011

$ES-F Updated Chart


The Market remains under pressure and price action is following the script for an expanded flat. Here is the updated chart from yesterday's edition of Heard On The Street. For today I was looking for a break of the lower boundary of the price channel. Assuming the market closes below this key are has very bearish implications.


I'll cover today's move on an intraday basis as well as identify a potential short opportunity in tonight's edition of the Market Pulse. In the interim, let's see how the Market closes. 

Best of Trading.

Tuesday, May 31, 2011

Heard On The Street

ANNOUNCEMENTS:

Moving forward, the weekly edition of Heard on the Street will focus on the monthly, weekly and daily perspectives, while my M-W-F edition of The Market Pulse will focus on the daily, 240 minute and lower time frame perspectives. In doing so, the weekly recap will cover more markets and detailed discussion regarding the larger trend in each market.

IS THE RISK TRADE STILL ON?

The last high that the market made was almost one month ago and up until Wednesday of last week, the market had lost 71.25 points. The wave pattern remains open for interpretation but favors a sideways to down bias. Learn what to expect by watching this weeks video edition of Heard On the Street where I'll cover the Emini S&P, Copper and the EUR-USD.


Wednesday, May 11, 2011

$ES_F: Updated Chart


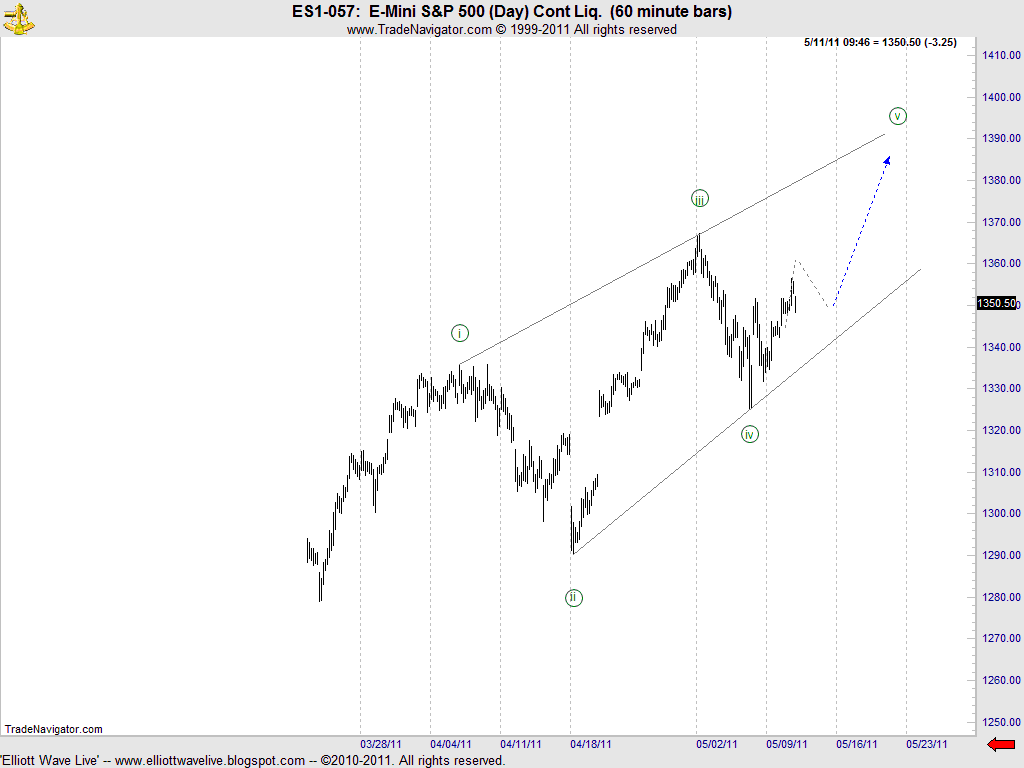
The last time we spoke about the ES_F, I left readers with an ending diagonal interpretation where w.iv circle had completed and I was looking for an up down up sequence to complete the pattern. Above is the chart. Notice that price did push higher.


 At the 240 min chart level of the front month contract, the overnight session pushed to where w.(c) = w.(a ) to complete w.a circle at 1358.25. I'm looking for an initial decline to the target box that represents 1343.50 - 1345.75, that will be followed by a three wave countertrend move, then a final round of selling to the .618 retracement of 1325.25 to 1358.25.  As soon as w.(a) of this initial decline has completed, additional fib termination points will be provided and discussed.

Best of Trading


Thursday, April 21, 2011

$ES_F : An Intraday Perspective

Wave patterns that start in three waves often spell trouble as there are a number of possible outcomes. Often an analyst will not be able to clearly identify the wave pattern until the pattern has completed!

In last night's blog post, I stated that I am unable to make a high probability forecast. Nothing has changed as the market appeared to be on a verge of following though, but a negative Philly Fed report coupled with a shortened trading week has at least temporarily beaten back the bulls. 


The chart attached is purposely marked without subdivision wave labels as of w.3. Each diamond represents a three wave pattern. If 1335.75 isn't taken out, then the possibility exists that price may rotate back into the previous range in 3 wave setting up a triangle w.4.

Note: I have also noticed that certain commodities exhibit a similar pattern. Sticking with the all-in-one theme of markets rising / falling together based upon the USD movement, there is a possibility that commodities are projecting the next move for equities as they appear to be slightly ahead in terms of pattern development. 

Should 1335.75 be taken out to the upside, then the wave structure will be limited to a few counts.Look for me to expand on the commodity theme and updated wave counts for the emini's during this weeks edition of "Heard On The Street".

Best of Trading

Monday, April 18, 2011

The Market Pulse


Well... that was a surprise. The S&P reaffirmed the US credit rating but rated it's debt  as negative. The market was already trading lower at the time but this news certainly accelerated the move.


The chart above shows the possible wave labeling based upon today's trade. It fits well  within the context of the analysis made in my weekly edition of Heard On The Street .

As constructive as today was to the downside, by the end of the day, the market rotated back into the territory of w.i circle... creating possible pair of 1-2's. This implies selling pressure greater than today's action for tomorrows trade. There can be no mistake about it as price should decline on massive volume and thrusting in nature.
Anything less and the wave personality doesn't fit price action and the count is suspect.


However, I might be ahead of myself here. While the wave labeling in the previous chart meets the requirements for a completed corrective wave, the time relationships is a bit short. Normally, most corrections of a previous price structure occurs in a minimum of  a .382 time relationship. From the chart, you can see that the termination point of w.(ii) of 1303.75 is well shy of this relationship and therefore implies that w.(ii) is still unfolding. If so the current wave labeling would be called into question. Possibly what we are witnessing is an indication of just how weak the market is and justifies the third wave extension. We'll see tomorrow.

Best of Trading


Sunday, April 17, 2011

Heard on The Street

Catch up on where the S&P, Gold and Crude Oil are heading in this weeks video addition of Heard on the Street.

Monday, March 28, 2011

The Maket Pulse

Tonight's update will be brief as much the content updates the analysis that was posted yesterday and updates the charts. If you missed yesterday's edition of Heard On The Street, you can listen to it by clicking the link.


At the 240 minute chart level, the mark opened up, closed the gap at 1315 and then sold off hard. The Doji candle, forewarned of indecision, which was followed by renewed selling pressure as represented by the bearish candle. Price traded to within a point of the .382 retracement of the advance from 1279 to 1315.25.  While the decline is constructive by the modest break of the lower boundary of the corrective price channel, only a five wave decline would indicate that the bears have regained control. Keep in mind that the initial decline from 1343.25 to 1243.25 can't be counted as a clean five waves. Readers of EWL, know from previous readings that there is a high probability that the decline was only in three waves.


However, that doesn't mean that a sizeable decline isn't underway before the longer term bullish trend continues. For example, what if the current wave structure is a 3-3-5 flat? W.4 (red) could decline to just above w.1 (1224.50) without invalidating the bullish count.  Of course should w.c of w.4 = w.a, at 1215, then the count would be invalid as a fourth wave can't enter into the span of w.1.

For tomorrow and Wednesday the key to identifying the overall wave structure is whether the decline from 1315.25 is in three or five waves. Should it develop in three waves, then the possibility of a triangle w.4 could be developing.... but I'm getting ahead of myself, so let's remain focused on one wave at a time.

Support below the market is 1292.7 5 - 1294.75. Structural support lies within w.(a) at 1296.25. So be looking for the current wave down to complete at these levels. We'll see what transpires thereafter and I'll post intraday updates on Twitter.

Best of Trading

Monday, February 21, 2011

Heard On The Street: #ES_F #Oil #Gold #Copper

The US Markets are closed today but you can still prepare for tomorrows trade by watching my video update of the S&P, Oil, Gold and Copper.


Best of Trading

Sunday, February 13, 2011

Heard On The Street


The last time we spoke I was looking for a new high in this market. Friday's price action carried the market to a new high... one that reached the targets stated in the 2/9/11 post of 1326.75 - 1329.25. If you review that post v.s. the wave count that I have presented here tonight, you will notice that I have changed the substructures of w.5 (red) to reflect greater proportionality between waves w. ii (purple) and w.iv (purple). Notice that the declines are harmonic in both price (14.03 and 13.07) and in time (15 and 14 bars) respectively. While the last few price bars from w.iv (blue) can be counted complete, I think that the market will extend higher in one final push.

Should the market extend higher it is important to note that currently w.(iii) < w.(i), therefore, w.(v) can't extend further than 1341.8 in $SPX and 1340 for  ES1-057 or w.(iii) will be the shortest wave and that would break the rules and guidelines of EWP. So from a trading perspective, we now have our lines in the sand where price MUST reverse or the count is incorrect.

We'll see what this week brings.


Best of Trading

Wednesday, February 2, 2011

The Market Pulse

The last time we spoke I left readers with the possibility that w.(2) had ended at 129950 and the appropriate wave labeling as contained here at :

http://elliottwavelive.blogspot.com/2011/01/market-pulse-s-and-crude-oil.html

That's not what transpired as the wave count was blown out after two days of advancing prices. While I was absolutely WRONG, two valuable lessons can be learned.

1. From the labeling in Monday's post I showed a completed five wave decline which had me looking up as the Elliott rules and guidelines state that a five wave structure is followed by a three wave countertrend structure. However, in the case of my incorrect assessment of the market, what I should have been looking for is another five wave advance to new highs (more on this later). My point is... that even though I was wrong on the wave labeling, the minimal expectation was at least a three wave advance.... thus from a directional standpoint I was right.

Here's why:


If a trader acted on the completion of the decline from 129950 to 127050, then the probability of price movement in the desired direction (up) would be likely because only two possibilities existed:

i) That the decline ending at 127050 was a C wave or,
ii) that the decline was wave i.

Bottom line: Both scenarios called for higher prices giving a trader confidence in executing a trade. Traders using the wave principle should always look for a minimum of a three wave structure in the anticipated direction.

2. Waves are fractal in nature, i.e. that smaller wave structures make up larger wave structures. My failure to evaluate the daily higher time frame caused me to prematurely call the top.


Here is the previous daily chart showing that w.(2) had ended. While I can and certainly did make a case for this wave labeling, it was incorrect.

Here is the revised labeling.


Looking at the wave structure from w. iii circle to w.iv circle, the pattern is a three wave decline. That's corrective. Now looking back at the 60 minute chart level that was presented earlier, notice that the decline from 129950 to 127050 was w.c at the daily chart level. Had I looked at the 60 minute fractal and then reviewed the daily chart level, I would have had a better idea that w.(2) wasn't indeed completed.


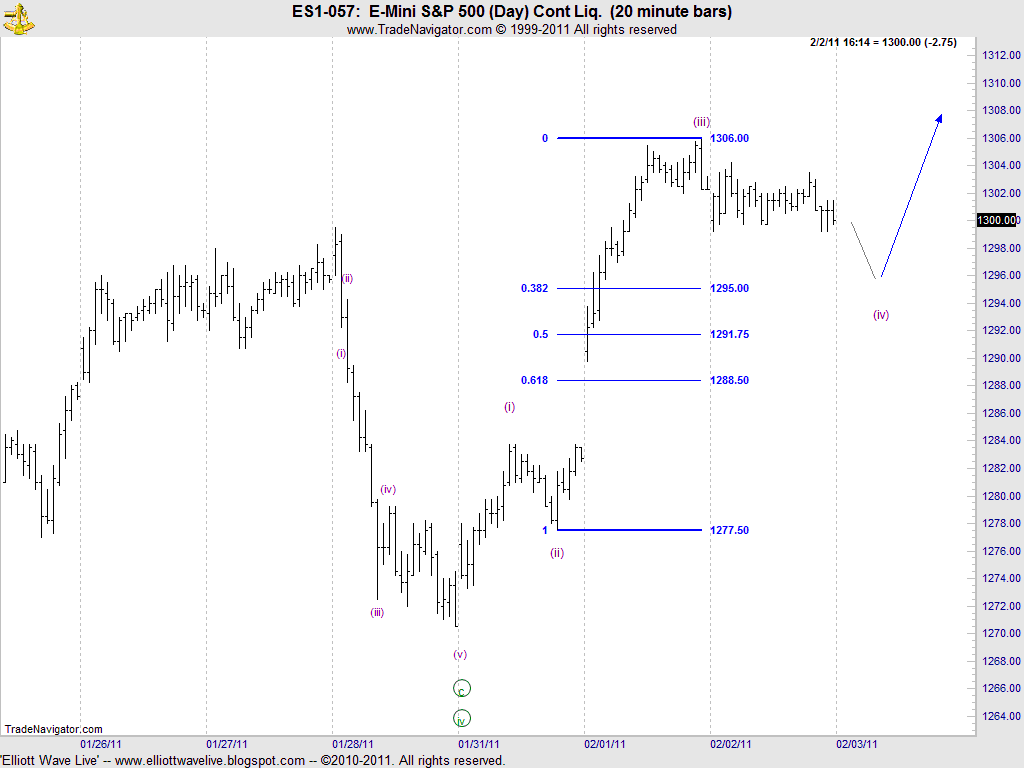
Let's look at the current advance from 127050. The market has completed w.(iii) and w.(iv) is unfolding. According to the rules and guidelines of EWP, second and fourth waves follow an alternating pattern. Since w.(ii) was sharp, w.(iv) should be a sideways correction. That's whats occurring.

The most common Fibonacci relationship for fourth wave declines is .382 ;therefore, I'll be looking for a completed pattern near 1295 that will be followed by another five wave impulsive move to new highs.

I hope you have found this information helpful.


Best of Trading