The last time we spoke I left readers with the possibility that w.(2) had ended at 129950 and the appropriate wave labeling as contained here at :
http://elliottwavelive.blogspot.com/2011/01/market-pulse-s-and-crude-oil.html
That's not what transpired as the wave count was blown out after two days of advancing prices. While I was absolutely WRONG, two valuable lessons can be learned.
1. From the labeling in Monday's post I showed a completed five wave decline which had me looking up as the Elliott rules and guidelines state that a five wave structure is followed by a three wave countertrend structure. However, in the case of my incorrect assessment of the market, what I should have been looking for is another five wave advance to new highs (more on this later). My point is... that even though I was wrong on the wave labeling, the minimal expectation was at least a three wave advance.... thus from a directional standpoint I was right.
Here's why:
If a trader acted on the completion of the decline from 129950 to 127050, then the probability of price movement in the desired direction (up) would be likely because only two possibilities existed:
i) That the decline ending at 127050 was a C wave or,
ii) that the decline was wave i.
Bottom line: Both scenarios called for higher prices giving a trader confidence in executing a trade. Traders using the wave principle should always look for a minimum of a three wave structure in the anticipated direction.
2. Waves are fractal in nature, i.e. that smaller wave structures make up larger wave structures. My failure to evaluate the daily higher time frame caused me to prematurely call the top.
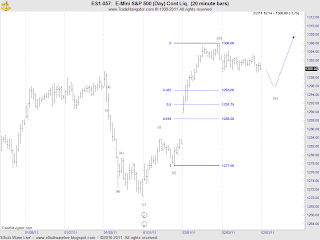
Here is the previous daily chart showing that w.(2) had ended. While I can and certainly did make a case for this wave labeling, it was incorrect.
Here is the revised labeling.
Looking at the wave structure from w. iii circle to w.iv circle, the pattern is a three wave decline. That's corrective. Now looking back at the 60 minute chart level that was presented earlier, notice that the decline from 129950 to 127050 was w.c at the daily chart level. Had I looked at the 60 minute fractal and then reviewed the daily chart level, I would have had a better idea that w.(2) wasn't indeed completed.
Let's look at the current advance from 127050. The market has completed w.(iii) and w.(iv) is unfolding. According to the rules and guidelines of EWP, second and fourth waves follow an alternating pattern. Since w.(ii) was sharp, w.(iv) should be a sideways correction. That's whats occurring.
The most common Fibonacci relationship for fourth wave declines is .382 ;therefore, I'll be looking for a completed pattern near 1295 that will be followed by another five wave impulsive move to new highs.
I hope you have found this information helpful.
Best of Trading


No comments:
Post a Comment