Best of Trading
An educational blogsite dedicated to teaching the Elliott Wave Principle, Fibonacci Ratio Analysis and Market Timing strategies. Primary focus is on the E-mini S&P. Please read the risk disclosures contained within this blog.
Showing posts with label SP. Show all posts
Thursday, October 18, 2012
What's Wrong With This Picture?
The four major markets shown below show how one market isn't correlated to the other three. From the 2007 top, each market fell in unison. A recovery phase has occurred in the DAX, DOW, S&P yet the SSE has been unable to make a meaningful recovery. This non confirmation may be something readers might want to evaluate.
Fair Disclosure Notice: I do not have a position in any of the aforementioned futures markets or securities related to this article.
Monday, July 18, 2011
The Market Pulse
This chart was presented in yesterdays video edition of Heard On The Street . If you missed it I highly recommend watching it. Two levels of significance were cited (1293.75 and 1352.25) in the video. Today's low of 1291.25 was significant for two reasons.:
- The print below 1293.75 effectively eliminated the running flat interpretation BUT the DOW and NASDAQ have not confirmed (see additional comments below). Given the length of each wave from 1252.25, a leading diagonal (that would allow for overlap) doesn't have the right structure therefore a 5th wave cannot be underway and,
- The area that we were watching on an intraday basis was reached, i.e. 1290.75. In RT and as the market was declining, I said "$ES-F: also watching the 60 min chart... 1290.75 is .618 of 1352.75- 1252.25 swing. Also 3 sd ". When price reaches a 3 sd .... 99% of all price action should be contained within the Bollinger Band.....so I was looking for a completed move at these levels.
This after-the-fact chart shows that price was actually contained within 2 standard deviations of the 20-sma by the time price actually reached 1290.75. The significance here is that a 2 sd typically contains 95% of all price action. The high probability that price would be contained and the fact that the .618 retracement was in agreement suggested that a turn was due. For tomorrow, I'll be watching the following resistance zones: the 20-sma to act as resistance. As of the close, the sma crosses 1304.75. Additional resistance (not shown) is 1305.25 - 1306.25 and the open gap.
Additional Comments:
At the daily chart level, the running triangle remains my alternate interpretation due to the reasons provided in my weekend video. While I haven't provided a count, my preferred pattern is the bearish pattern described in the video. The general shape and outcome are clear. Once the DOW and NASDAQ confirm the same overlap that is found in the S&P, the three indices will be aligned. At that time I'll discuss the larger trend. Until then we'll stay focused on a wave at a time.
Best of Trading
Labels:
Bollinger Bands,
DOW,
NASDAQ,
Resistance,
Running Flat,
Running Triangle,
SP
Monday, March 7, 2011
The Market Pulse
In this weeks edition of "Heard on The Street", I laid out a bullish and bearish forecast for the S&P with the expectation that the index would have to fall hard today in order to maintain my bearish stance.
After the opening bell, the market quickly turned tail and sold off on higher volume. That's another distribution day where institutions were selling. The lower boundary of the Elliott Channel also gave way bolstering the bearish case. This was what I wanted to see and is typical of third wave price action.
The clearest wave structure can be seen in the S&P cash, rather than the E-minis. A series of 1-2's has developed but I would like to see a further decline whereas price breaks critical support at 1294.26 or 1292.5, the equivalent in the ES-F. Until then, the alternative count remains viable. Likewise a break above critical resistance at 1332.28 or 1332.50 in the ES-F, would signal that the alternative count would become the preferred wave count and that price would make a new recovery high above 1343.
I hope you found this information helpful.
Best of Trading
After the opening bell, the market quickly turned tail and sold off on higher volume. That's another distribution day where institutions were selling. The lower boundary of the Elliott Channel also gave way bolstering the bearish case. This was what I wanted to see and is typical of third wave price action.
The clearest wave structure can be seen in the S&P cash, rather than the E-minis. A series of 1-2's has developed but I would like to see a further decline whereas price breaks critical support at 1294.26 or 1292.5, the equivalent in the ES-F. Until then, the alternative count remains viable. Likewise a break above critical resistance at 1332.28 or 1332.50 in the ES-F, would signal that the alternative count would become the preferred wave count and that price would make a new recovery high above 1343.
I hope you found this information helpful.
Best of Trading
Labels:
Distribution Day,
Elliott Channel,
Emini SP Futures,
SP
Wednesday, February 2, 2011
The Market Pulse
The last time we spoke I left readers with the possibility that w.(2) had ended at 129950 and the appropriate wave labeling as contained here at :
http://elliottwavelive.blogspot.com/2011/01/market-pulse-s-and-crude-oil.html
That's not what transpired as the wave count was blown out after two days of advancing prices. While I was absolutely WRONG, two valuable lessons can be learned.
1. From the labeling in Monday's post I showed a completed five wave decline which had me looking up as the Elliott rules and guidelines state that a five wave structure is followed by a three wave countertrend structure. However, in the case of my incorrect assessment of the market, what I should have been looking for is another five wave advance to new highs (more on this later). My point is... that even though I was wrong on the wave labeling, the minimal expectation was at least a three wave advance.... thus from a directional standpoint I was right.
Here's why:
If a trader acted on the completion of the decline from 129950 to 127050, then the probability of price movement in the desired direction (up) would be likely because only two possibilities existed:
i) That the decline ending at 127050 was a C wave or,
ii) that the decline was wave i.
Bottom line: Both scenarios called for higher prices giving a trader confidence in executing a trade. Traders using the wave principle should always look for a minimum of a three wave structure in the anticipated direction.
2. Waves are fractal in nature, i.e. that smaller wave structures make up larger wave structures. My failure to evaluate the daily higher time frame caused me to prematurely call the top.
Here is the previous daily chart showing that w.(2) had ended. While I can and certainly did make a case for this wave labeling, it was incorrect.
Here is the revised labeling.
Looking at the wave structure from w. iii circle to w.iv circle, the pattern is a three wave decline. That's corrective. Now looking back at the 60 minute chart level that was presented earlier, notice that the decline from 129950 to 127050 was w.c at the daily chart level. Had I looked at the 60 minute fractal and then reviewed the daily chart level, I would have had a better idea that w.(2) wasn't indeed completed.
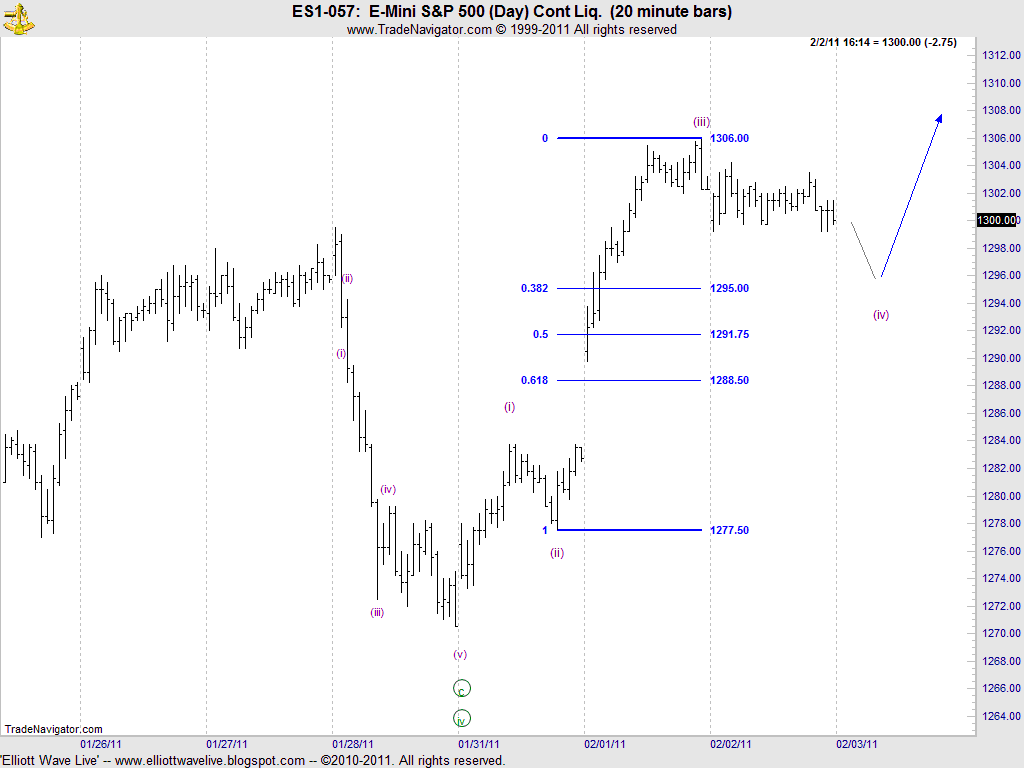
Let's look at the current advance from 127050. The market has completed w.(iii) and w.(iv) is unfolding. According to the rules and guidelines of EWP, second and fourth waves follow an alternating pattern. Since w.(ii) was sharp, w.(iv) should be a sideways correction. That's whats occurring.
The most common Fibonacci relationship for fourth wave declines is .382 ;therefore, I'll be looking for a completed pattern near 1295 that will be followed by another five wave impulsive move to new highs.
I hope you have found this information helpful.
Best of Trading
http://elliottwavelive.blogspot.com/2011/01/market-pulse-s-and-crude-oil.html
That's not what transpired as the wave count was blown out after two days of advancing prices. While I was absolutely WRONG, two valuable lessons can be learned.
1. From the labeling in Monday's post I showed a completed five wave decline which had me looking up as the Elliott rules and guidelines state that a five wave structure is followed by a three wave countertrend structure. However, in the case of my incorrect assessment of the market, what I should have been looking for is another five wave advance to new highs (more on this later). My point is... that even though I was wrong on the wave labeling, the minimal expectation was at least a three wave advance.... thus from a directional standpoint I was right.
Here's why:
If a trader acted on the completion of the decline from 129950 to 127050, then the probability of price movement in the desired direction (up) would be likely because only two possibilities existed:
i) That the decline ending at 127050 was a C wave or,
ii) that the decline was wave i.
Bottom line: Both scenarios called for higher prices giving a trader confidence in executing a trade. Traders using the wave principle should always look for a minimum of a three wave structure in the anticipated direction.
2. Waves are fractal in nature, i.e. that smaller wave structures make up larger wave structures. My failure to evaluate the daily higher time frame caused me to prematurely call the top.
Here is the previous daily chart showing that w.(2) had ended. While I can and certainly did make a case for this wave labeling, it was incorrect.
Here is the revised labeling.
Looking at the wave structure from w. iii circle to w.iv circle, the pattern is a three wave decline. That's corrective. Now looking back at the 60 minute chart level that was presented earlier, notice that the decline from 129950 to 127050 was w.c at the daily chart level. Had I looked at the 60 minute fractal and then reviewed the daily chart level, I would have had a better idea that w.(2) wasn't indeed completed.
Let's look at the current advance from 127050. The market has completed w.(iii) and w.(iv) is unfolding. According to the rules and guidelines of EWP, second and fourth waves follow an alternating pattern. Since w.(ii) was sharp, w.(iv) should be a sideways correction. That's whats occurring.
The most common Fibonacci relationship for fourth wave declines is .382 ;therefore, I'll be looking for a completed pattern near 1295 that will be followed by another five wave impulsive move to new highs.
I hope you have found this information helpful.
Best of Trading
Monday, January 31, 2011
The Market Pulse: S&P and Crude Oil
S&P
As expected, the S&P completed w.i circle and rallied. I've labeled the substructure for your review. Second waves typically retrace 50%- 62% of the previous wave, with 62% being most common. By looking at the current wave structure, there are a number of possibilities that could be unfolding. I'll have to see more of the wave structure to be certain but I will post an updated chart and discuss the implications thereof.
Crude Oil
I want to take a moment to update readers on Crude Oil. On 1/24/11, I alerted readers that Oil would find support between 8465 - 8510. The low to the exact tick was 8510. If you would like to review that video click here: http://elliottwavelive.blogspot.com/2011/01/heard-on-street-s-gold-oil-and-usd.html
Prices have rocketed and challenged the previous high of 9325. If my wave count is correct, traders that missed the termination of w.4 may get another shot as prices should decline over the next day or so to the area surrounding the previous fourth wave (8845) or the .618 retracement (8805).
I'll be monitoring this closely as this may be one of the last opportunities to ride the w.5 impulse wave to $100 - $110 .
I hope you found this update helpful.
Bst of Trading.
As expected, the S&P completed w.i circle and rallied. I've labeled the substructure for your review. Second waves typically retrace 50%- 62% of the previous wave, with 62% being most common. By looking at the current wave structure, there are a number of possibilities that could be unfolding. I'll have to see more of the wave structure to be certain but I will post an updated chart and discuss the implications thereof.
Crude Oil
I want to take a moment to update readers on Crude Oil. On 1/24/11, I alerted readers that Oil would find support between 8465 - 8510. The low to the exact tick was 8510. If you would like to review that video click here: http://elliottwavelive.blogspot.com/2011/01/heard-on-street-s-gold-oil-and-usd.html
Prices have rocketed and challenged the previous high of 9325. If my wave count is correct, traders that missed the termination of w.4 may get another shot as prices should decline over the next day or so to the area surrounding the previous fourth wave (8845) or the .618 retracement (8805).
I'll be monitoring this closely as this may be one of the last opportunities to ride the w.5 impulse wave to $100 - $110 .
I hope you found this update helpful.
Bst of Trading.
Labels:
Crude Oil,
Futures Trading,
SP
Wednesday, January 26, 2011
The Market Pulse
The ES-F reached a new recovery high today that effectly removed any bearish bias. It is confirmed the DOW's leadership... a negative sign for the bears. If you are watching price action you know that this market is struggling to stay afloat.
The new high means that our next expansion that may be the termination point of w.5 is where w.5 = .618 (w.1-3) at 1306.25. I've also made a slight relabeling of the subdivisions of the most recent advance from w.4 for your review.
Developing patience to wait and wait some more for the market to make it abundantly clear when it is time to climb aboard is paramount. Don't jump the gun. While we attempt to label the appropriate substructure as an exercise,... trying to call a top often takes several attempts and is costly to your account and mental attitude. Market manipulators routinely run stops before moving the market the other way. Simply put, IMO, a trader should never trade the the terminus of w.5. Let the market commit to you before you commit your hard earned money to it.
Tomorrow is another day. Until I see a completed five waves down, a tradeable top is not in place.
Best of Trading
Subscribe to:
Posts (Atom)