Showing posts with label Running Flat. Show all posts

Wednesday, June 6, 2012

S&P Updated Trade Plan

As most of my followers know, I like to keep things real... meaning I don't BS anyone and try to provide educational material in real time. As such, here is the chart that I left readers with last night. It includes most recent price action as well as my original trade plan that was discussed last evening.


As you can see, the thin ON session pushed price to the higher 2.0 RF resistance levels cited in this chart.  That's gone beyond a reasonable price level for what I would call a throw over in an ending diagonal pattern. However, that may not mean that my trade plan changes. here's why.

1. 1297.77 is also a Gann 90 degree resistance level that is in agreement with cited fibs.
2. The trade plan called for an actionable plan should price reach my levels in the ON session.


That plan called for confirming a turn in five waves!
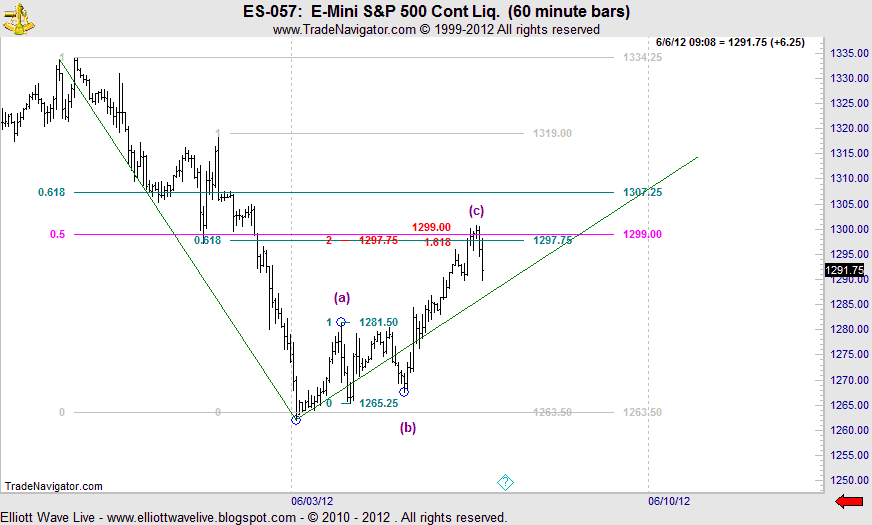


Above is an updated chart through 9:09 a.m. est. detailing my updated wave count. This count is part of my trade plan and is only a possible attempt to describe the markets position in real time. w.(c) = 1.618 w.(a), where w.(b) is a running flat. The overall interpretation is still subject to confirmation of five waves down before the possibility of making any trading decisions. Obviously breaks above 1300.75 negate. 

Let's see how the day goes.

Best of Trading

=======================================================================
ElliottwaveLive is not an investment advisory service or broker dealer. None of its contributors are registered investment advisors, licensed stock brokers or CTA's. The author may hold short term and long term positions in the futures, stocks and ETF's discussed herein. The author may also trade around those positions which may be in direct conflict with your positions. Complete trade disclosures of the contributor’s holdings are posted at www.elliottwavelive.blogspot.com. See Trader Disclosure. 


Trade at your own risk. The blog site, Newsletter and all other information, material and content accessible from this Site (collectively, the "Content")  provided herein provides the context for market analysis with respect to a market's, a security or a commodity's general position utilizing the Elliott Wave Principle. The Content contained herein are the opinion and general comments of the author and is based upon information that Mr. Sinibaldi considers reliable but neither ElliottWaveLive nor he warrants it's completeness or accuracy and it should not be relied upon as such. Mr. Sinibaldi or ElliottWaveLive (collectively, referred to as “EWL”) are not under any obligation to update or correct any content provided on this website. Any statements and or opinions are subject to change without notice. The content and comments contained herein neither purports nor intends to be, specific trading advice. It has been prepared without regard to any particular person's investment objectives, financial situation and particular needs. Information should not be considered as an offer or enticement to buy, sell or trade. 


A more and comprehensive Risk Disclaimer and Disclosure Statements is available within the left margin of this blog site.


Friday, July 29, 2011

ES_F FLASH UPDATE


In my 7/27/11 call, I said " two bullish interpretations hang by a tread and one or both may be eliminated within the next few days, leaving no bullish counts". If you've been following along with my 2007-2011 analogy, this comes as no surprise. However, I feel that I'm obligated to present an objective and unbiased assesment of the market and let you decide for yourself whether the evidence is compelling to make either case. Given that.....

..... during the ON session, the running flat interpretation was invalidated by printing below 1291.25. I'll be monitoring the intraday progress of the markets and update readers with any new developments.

Make sure to watch my weekend video where I will be updating the 2007-2011 analogy as well as my weekly and daily counts.

Best of Trading

Wednesday, July 27, 2011

The Market Pulse

The Bull / Bear Debate Continues

Introduction:

Earlier today I posted a special video addition of Heard On The Street that updated the current status of the 2007-2011 analogy and my expectation for the progress of the pattern. If you haven't watched that video, I recommend that you do so because this update expands upon the content provided and breaks down the intraday wave count from a bearish view. One without the other will not make much sense. You can listen to the call here.


The Bearish Case:


Here, the bearish interpretation at the daily chart level, has me looking for continued selling pressure followed by a three wave advance to complete w.E. A bounce may intervene but the larger trend shall remain down.


At the intraday chart level, this chart depicts the anticipated progress of the pattern (please click on the video link to obtain for further commentary).


The Bullish Case:

In my opinion, two bullish interpretations hang by a tread and one or both may be eliminated within the next few days, leaving no bullish counts. 


At the daily chart level, the running triangle is still viable. Today, the market gaped down but gaps are not usually found in second waves, they're found in third waves. Also, according to the rules and guidelines of the Elliott Wave Principle, w.2 can't exceed the origin of w.1.  A break of 1291.25 negates the viewpoint that w. 5 was underway.  Only a break of 1252.25, the w.c low would finally extinguish this view. 


The second pattern is the running flat. Flaws already exist in this interpretation. If you recall, w.4 overlapped w.1 but not on a closing basis. A small degree of leeway was granted as the DOW and NASDAQ did not confirm the same structure. That was then. Prints below 1291.25 negate this interpretation.

Let's see what unfolds tomorrow.


Best of Trading


Monday, July 18, 2011

The Market Pulse


This chart was presented in yesterdays video edition of Heard On The Street . If you missed it I highly recommend watching it. Two levels of significance were cited (1293.75 and 1352.25) in the video. Today's low of 1291.25 was significant for two reasons.:

  1. The print below 1293.75 effectively eliminated the running flat interpretation BUT the DOW and NASDAQ have not confirmed (see additional comments below). Given the length of each wave from 1252.25, a leading diagonal (that would allow for overlap) doesn't have the right structure therefore a 5th wave cannot be underway and,
  2.  The area that we were watching on an intraday basis was reached, i.e. 1290.75.  In RT and as the market was declining, I said "$ES-F: also watching the 60 min chart... 1290.75 is .618 of 1352.75- 1252.25 swing. Also 3 sd ". When  price reaches a 3 sd ....  99% of all price action should be contained within the Bollinger Band.....so I was looking for a completed move at these levels. 


This after-the-fact chart  shows that price was actually contained within 2 standard deviations of the 20-sma  by the time price actually reached 1290.75. The significance here is that a 2 sd typically contains 95% of all price action. The high probability that price would be contained and the fact that the .618 retracement was in agreement  suggested that a turn was due. For tomorrow, I'll be watching the following resistance zones: the 20-sma to act as resistance. As of the close, the sma crosses 1304.75. Additional resistance (not shown) is 1305.25 - 1306.25 and the open gap.


Additional Comments:

At the daily chart level, the running triangle remains my alternate interpretation due to the reasons provided in my weekend video. While I haven't provided a count, my preferred pattern is the bearish pattern described in the video. The general shape and outcome are clear. Once the DOW and NASDAQ confirm the same overlap that is found in the S&P, the three indices will be aligned. At that time I'll discuss the larger trend. Until then we'll stay focused on a wave at a time.

Best of Trading