Showing posts with label trade plan. Show all posts

Monday, December 24, 2012

Coffee: Nearing An Inflection Point ?

Coffee To Rally in 2013?


It seems like an eternity but Coffee may be nearing an important inflection point that should lead to a significant counter trend rally!

I've been following the decline in coffee since May 2011 and posted my trade plan for this market.


Since that time, price has continued to grind lower.  I've listed two downside targets that represent where:  w.5= w.1 at 114.65 and w.5 = .618{w.1-w.3} at 95.05. Also not that the previous 4th, at one lesser degree, a common elliott support zone is right in this area.


Dropping to the weekly level, we can see that the minimal requirements for a completed w.5 circle has already been met i.e. price has made a new low below w.3, yet the two downside targets at the monthly level are still possible. 

Not shown, MOMO indicators exhibit bullish divergence but my suspicion is that we need to make at least another low. 

If you trade coffee it's time to watch price action closely. 2013 main bring significant gains! 


Best of Trading


======================================================================
ElliottwaveLive is not an investment advisory service or broker dealer. None of its contributors are registered investment advisors, licensed stock brokers or CTA's. The author may hold short term and long term positions in the futures, stocks and ETF's discussed herein. The author may also trade around those positions which may be in direct conflict with your positions. Complete trade disclosures of the contributor’s holdings are posted at www.elliottwavelive.blogspot.com. See Trader Disclosure. 

Trade at your own risk. The blog site, Newsletter and all other information, material and content accessible from this Site (collectively, the "Content")  provided herein provides the context for market analysis with respect to a market's, a security or a commodity's general position utilizing the Elliott Wave Principle. The Content contained herein are the opinion and general comments of the author and is based upon information that Mr. Sinibaldi considers reliable but neither ElliottWaveLive nor he warrants it's completeness or accuracy and it should not be relied upon as such. Mr. Sinibaldi or ElliottWaveLive (collectively, referred to as “EWL”) are not under any obligation to update or correct any content provided on this website. Any statements and or opinions are subject to change without notice. The content and comments contained herein neither purports nor intends to be, specific trading advice. It has been prepared without regard to any particular person's investment objectives, financial situation and particular needs. Information should not be considered as an offer or enticement to buy, sell or trade. 

A more and comprehensive Risk Disclaimer and Disclosure Statements is available within the left margin of this blogsite.   
======================================================================

Fair Disclosure Notice: I do not have a position in any of the aforementioned futures markets or securities related to this article. 

Friday, October 19, 2012

Corn May Be Ripe For Picking: Follow the Trade

Corn Set Up May Be Ripe For Pickings....


I've been following the impulsive move in corn for awhile and I believe that corn is nearing a position where a possible trade setup is developing. This set up comes on the heals of my previous work featured here and in my opinion may be one of high reward / low risk.

Note: The following work was completed last evening so there may be some progression in price that differs from these time stamped charts. 

Since I intend to take an actual position in the ETF, ticker CORN, rather than the futures contract, readers will have to use this blog post as a guide when labeling their CORN charts. 

Over the next few weeks, periodic updates will be made so that readers can learn how I'm actively using elliott wave in real time with regard to order entry, risk management and taking profit. It should provide an excellent learning experience!

The Analysis


At the weekly chart level, Corn is advancing impulsively in five waves, of which w. (5) is underway and  mature in the fact that only w.5 red is needed to complete the move before a meaningful top is in place.

A typical elliott wave Fibonacci target for a w.5 = .618 {w.1 - w.3} at 914^4


Turning to the daily chart level, I've labeled the subdivisions of w. 4 and waves w.i and w.ii circle of w. 5 appear to be complete. Should my analysis be correct, price progression should follow the general outline provided which becomes my trade plan for this market. 


The Set Up


Dropping to the 4 hr chart, my trade plan shown at the daily chart level now includes the internal subdivisions of the w.iii circle advance. 

In order for me to consider risking my money, I'm looking for an entry that limits and clearly defines my risk while maximizes my reward. 

Pre-Trade Conditions: 

1. Corn must sketch out the remainder of w.(i) without any overlap of 745^2 (w.i extreme). In doing so, a five wave advance occurs that doesn't break the rules for impulsive waves. 

2. According to Elliott, an actionary or trend wave (5 wave move) is followed by a reactionary wave that develops in 3 waves, therefore a w.(ii) counter trend move should occur. This corrective move CANNOT print below 732^4 or the count becomes invalid.

3. Ideally, the depth of the retracement of w.(i) will not go beyond .618 w.(i) which will be calculated after the w.(i) advance has terminated. 

We'll leave it there for now. My next post in this series will review that the pre-trade conditions were met;  describe w.(ii) in further detail and set forth the conditions of the actual trade. 

Until then.....

Best of Trading


======================================================================
ElliottwaveLive is not an investment advisory service or broker dealer. None of its contributors are registered investment advisors, licensed stock brokers or CTA's. The author may hold short term and long term positions in the futures, stocks and ETF's discussed herein. The author may also trade around those positions which may be in direct conflict with your positions. Complete trade disclosures of the contributor’s holdings are posted at www.elliottwavelive.blogspot.com. See Trader Disclosure. 

Trade at your own risk. The blog site, Newsletter and all other information, material and content accessible from this Site (collectively, the "Content")  provided herein provides the context for market analysis with respect to a market's, a security or a commodity's general position utilizing the Elliott Wave Principle. The Content contained herein are the opinion and general comments of the author and is based upon information that Mr. Sinibaldi considers reliable but neither ElliottWaveLive nor he warrants it's completeness or accuracy and it should not be relied upon as such. Mr. Sinibaldi or ElliottWaveLive (collectively, referred to as “EWL”) are not under any obligation to update or correct any content provided on this website. Any statements and or opinions are subject to change without notice. The content and comments contained herein neither purports nor intends to be, specific trading advice. It has been prepared without regard to any particular person's investment objectives, financial situation and particular needs. Information should not be considered as an offer or enticement to buy, sell or trade. 

A more and comprehensive Risk Disclaimer and Disclosure Statements is available within the left margin of this blogsite.   
======================================================================

Fair Disclosure Notice: I do not have a position in any of the aforementioned futures markets or securities related to this article. 


Saturday, August 4, 2012

Coffee Update and a Review of Wave Personality


After a volatile month of July, a review of the the decline from 192.2 has not yet proven itself. One could come to the conclusion that this market remains under pressure and you would probably be correct in your assessment. To what extent?

If the pressure truly remains to the downside and 150.10 will be surrendered, price action over the next two trading days must exhibit the personality of a third wave move.

From the 240 min chart, I have labeled what type of price action represents a third wave move AND what would not constitute one. In a third wave, we should see several days of heavy selling as price extends to the downside in long bars. This would bolster my labeling and my interpretation offered in my personal trade plan.You can read more about that trade plan at :  Elliott Wave Live: Coffee Anyone?

If we don't start seeing this market extend and see what I have described as "Not This", the possibility exists that either the bottom is already in or a more complex corrective move may be unfolding.

In conclusion, the correct use of Elliott Wave balances price with wave personality (structure). So make sure that you apply the applicable rule of wave personality to your wave labeling efforts. You'll see better results!

I hope you found this education tip helpful and...

Best of Trading


======================================================================
ElliottwaveLive is not an investment advisory service or broker dealer. None of its contributors are registered investment advisors, licensed stock brokers or CTA's. The author may hold short term and long term positions in the futures, stocks and ETF's discussed herein. The author may also trade around those positions which may be in direct conflict with your positions. Complete trade disclosures of the contributor’s holdings are posted at www.elliottwavelive.blogspot.com. See Trader Disclosure. 

Trade at your own risk. The blog site, Newsletter and all other information, material and content accessible from this Site (collectively, the "Content")  provided herein provides the context for market analysis with respect to a market's, a security or a commodity's general position utilizing the Elliott Wave Principle. The Content contained herein are the opinion and general comments of the author and is based upon information that Mr. Sinibaldi considers reliable but neither ElliottWaveLive nor he warrants it's completeness or accuracy and it should not be relied upon as such. Mr. Sinibaldi or ElliottWaveLive (collectively, referred to as “EWL”) are not under any obligation to update or correct any content provided on this website. Any statements and or opinions are subject to change without notice. The content and comments contained herein neither purports nor intends to be, specific trading advice. It has been prepared without regard to any particular person's investment objectives, financial situation and particular needs. Information should not be considered as an offer or enticement to buy, sell or trade. 

A more and comprehensive Risk Disclaimer and Disclosure Statements is available within the left margin of this blog site.   

Tuesday, July 17, 2012

Natural Gas Chart Update


The chart above is what I left readers in my video.....  Elliott Wave Live: Is It Really Time To Be Bullish Natural Gas?

From the weekly chart, price action has not made any significant advance that confirms a bullish w.1 and negates a w.(4) counter-trend interpretation.


Dropping to the daily chart level, what we do know, as of the time of this post, is the following:

  • Price remains within a corrective price channel.
  • The move from w.(3) low appears to be in a sharp, three wave zig-zig.
  • Price traded to 3.06, very near the level where w.c = w.a @ 3.088

While each bullet point favors a corrective interpretation, only price can confirm a wave count. A price break of 2.659 (key support) may bolster my interpretation, but other bullish scenarios could be applied. Therefore, according to my personal trade plan, I can afford to remain market neutral as described within my original post. 

Best of Trading


======================================================================
ElliottwaveLive is not an investment advisory service or broker dealer. None of its contributors are registered investment advisors, licensed stock brokers or CTA's. The author may hold short term and long term positions in the futures, stocks and ETF's discussed herein. The author may also trade around those positions which may be in direct conflict with your positions. Complete trade disclosures of the contributor’s holdings are posted at www.elliottwavelive.blogspot.com. See Trader Disclosure. 

Trade at your own risk. The blog site, Newsletter and all other information, material and content accessible from this Site (collectively, the "Content")  provided herein provides the context for market analysis with respect to a market's, a security or a commodity's general position utilizing the Elliott Wave Principle. The Content contained herein are the opinion and general comments of the author and is based upon information that Mr. Sinibaldi considers reliable but neither ElliottWaveLive nor he warrants it's completeness or accuracy and it should not be relied upon as such. Mr. Sinibaldi or ElliottWaveLive (collectively, referred to as “EWL”) are not under any obligation to update or correct any content provided on this website. Any statements and or opinions are subject to change without notice. The content and comments contained herein neither purports nor intends to be, specific trading advice. It has been prepared without regard to any particular person's investment objectives, financial situation and particular needs. Information should not be considered as an offer or enticement to buy, sell or trade. 

A more and comprehensive Risk Disclaimer and Disclosure Statements is available within the left margin of this blog site.   


Saturday, July 7, 2012

Coffee Anyone?


My Personal Trade Plan


I've been following the monthly chart of coffee for quite some time. Most recent price action is in three waves to complete w.4 circle. Notice the long shadow tail as the 3-wave structure completed. That's selling pressure right at the .382 retracement of w.3 (not shown). I'm now looking for a 5-wave decline into 135.15 to end the sequence.


Turning my attention to the daily chart, a doji candle, represents indecision and also hints that the advance is complete. 


The final chart of ticker symbol JO shows my target for the completion of w.5 circle at 32.50 where I will be looking to go long this market.


Best of Trading


======================================================================
ElliottwaveLive is not an investment advisory service or broker dealer. None of its contributors are registered investment advisors, licensed stock brokers or CTA's. The author may hold short term and long term positions in the futures, stocks and ETF's discussed herein. The author may also trade around those positions which may be in direct conflict with your positions. Complete trade disclosures of the contributor’s holdings are posted at www.elliottwavelive.blogspot.com. See Trader Disclosure. 


Trade at your own risk. The blog site, Newsletter and all other information, material and content accessible from this Site (collectively, the "Content")  provided herein provides the context for market analysis with respect to a market's, a security or a commodity's general position utilizing the Elliott Wave Principle. The Content contained herein are the opinion and general comments of the author and is based upon information that Mr. Sinibaldi considers reliable but neither ElliottWaveLive nor he warrants it's completeness or accuracy and it should not be relied upon as such. Mr. Sinibaldi or ElliottWaveLive (collectively, referred to as “EWL”) are not under any obligation to update or correct any content provided on this website. Any statements and or opinions are subject to change without notice. The content and comments contained herein neither purports nor intends to be, specific trading advice. It has been prepared without regard to any particular person's investment objectives, financial situation and particular needs. Information should not be considered as an offer or enticement to buy, sell or trade. 


A more and comprehensive Risk Disclaimer and Disclosure Statements is available within the left margin of this blog site.   

Wednesday, June 6, 2012

S&P Updated Trade Plan

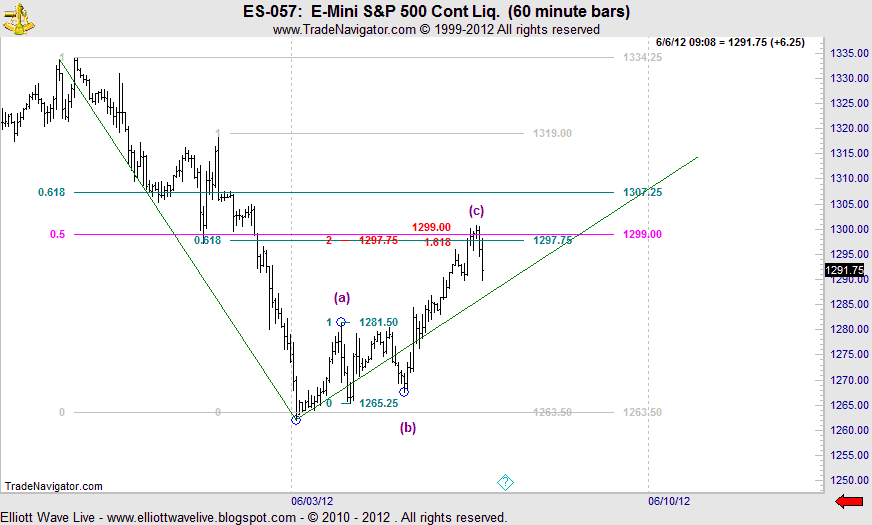
As most of my followers know, I like to keep things real... meaning I don't BS anyone and try to provide educational material in real time. As such, here is the chart that I left readers with last night. It includes most recent price action as well as my original trade plan that was discussed last evening.


As you can see, the thin ON session pushed price to the higher 2.0 RF resistance levels cited in this chart.  That's gone beyond a reasonable price level for what I would call a throw over in an ending diagonal pattern. However, that may not mean that my trade plan changes. here's why.

1. 1297.77 is also a Gann 90 degree resistance level that is in agreement with cited fibs.
2. The trade plan called for an actionable plan should price reach my levels in the ON session.


That plan called for confirming a turn in five waves!


Above is an updated chart through 9:09 a.m. est. detailing my updated wave count. This count is part of my trade plan and is only a possible attempt to describe the markets position in real time. w.(c) = 1.618 w.(a), where w.(b) is a running flat. The overall interpretation is still subject to confirmation of five waves down before the possibility of making any trading decisions. Obviously breaks above 1300.75 negate. 

Let's see how the day goes.

Best of Trading

=======================================================================
ElliottwaveLive is not an investment advisory service or broker dealer. None of its contributors are registered investment advisors, licensed stock brokers or CTA's. The author may hold short term and long term positions in the futures, stocks and ETF's discussed herein. The author may also trade around those positions which may be in direct conflict with your positions. Complete trade disclosures of the contributor’s holdings are posted at www.elliottwavelive.blogspot.com. See Trader Disclosure. 


Trade at your own risk. The blog site, Newsletter and all other information, material and content accessible from this Site (collectively, the "Content")  provided herein provides the context for market analysis with respect to a market's, a security or a commodity's general position utilizing the Elliott Wave Principle. The Content contained herein are the opinion and general comments of the author and is based upon information that Mr. Sinibaldi considers reliable but neither ElliottWaveLive nor he warrants it's completeness or accuracy and it should not be relied upon as such. Mr. Sinibaldi or ElliottWaveLive (collectively, referred to as “EWL”) are not under any obligation to update or correct any content provided on this website. Any statements and or opinions are subject to change without notice. The content and comments contained herein neither purports nor intends to be, specific trading advice. It has been prepared without regard to any particular person's investment objectives, financial situation and particular needs. Information should not be considered as an offer or enticement to buy, sell or trade. 


A more and comprehensive Risk Disclaimer and Disclosure Statements is available within the left margin of this blog site.