Every day I compose and publish a list at www.mikesinibaldi.com of S&P 500 stocks that have the greatest percentage increase above their average volume in the past 30 days or that exhibit gaping characteristics within elliott wave patterns. Usually, these traits are a sign that institutions may be buying or selling stock and make a great list of stocks to watch for further investigation.
Today I'd like to show you how to effectively use those scans with a most recent bullish candidate.
Click here for details.
Best of Trading
Showing posts with label trading. Show all posts
Showing posts with label trading. Show all posts
Tuesday, August 13, 2013


Thursday, May 2, 2013
Does $USD - JPY Have Room To Run?

$USD-JPY has progressed nicely and looks to have completed w.(3) of an ongoing advance that should unfold in five waves. Currently, w.(3) =2.618 w.(1). Should my assessment of this currency pair and preferred wave interpretation be proven correct then a fourth wave should be underway. Prints above 99.947 would negate my bias and be subject to re-evaluation of subsequent price action.
According to the guidelines of elliott wave theory, 2nd and 4th waves typically alternate and are usually Fibonacci relationships to each other in both time and length. Since w.(2) unfolded in zig-zag, I'm looking for w.(4) to unfold in a time consuming sideways to down affair whose extent would target the most common Fibonacci relationship of w.(4) = .382 w.(3) or 91.04. Thereafter, a final impulsive rally should unfold in five waves to complete w.1 circle.
With regards to time, w.(2) took six months. Accordingly, w.(4) should be a Fibonacci multiple of w.(2) or put another way, w.(2) is a Fibonacci multiple of w.(4).
Let's leave it there for now and see what develops.
Best of Trading
======================================================================
ElliottwaveLive is not an investment advisory service or broker dealer. None of its contributors are registered investment advisors, licensed stock brokers or CTA's. The author may hold short term and long term positions in the futures, stocks and ETF's discussed herein. The author may also trade around those positions which may be in direct conflict with your positions. Complete trade disclosures of the contributor’s holdings are posted at www.elliottwavelive.blogspot.com. See Trader Disclosure.
Trade at your own risk. The blog site, Newsletter and all other information, material and content accessible from this Site (collectively, the "Content") provided herein provides the context for market analysis with respect to a market's, a security or a commodity's general position utilizing the Elliott Wave Principle. The Content contained herein are the opinion and general comments of the author and is based upon information that Mr. Sinibaldi considers reliable but neither ElliottWaveLive nor he warrants it's completeness or accuracy and it should not be relied upon as such. Mr. Sinibaldi or ElliottWaveLive (collectively, referred to as “EWL”) are not under any obligation to update or correct any content provided on this website. Any statements and or opinions are subject to change without notice. The content and comments contained herein neither purports nor intends to be, specific trading advice. It has been prepared without regard to any particular person's investment objectives, financial situation and particular needs. Information should not be considered as an offer or enticement to buy, sell or trade.
A more and comprehensive Risk Disclaimer and Disclosure Statements is available within the left margin of this blogsite.
======================================================================
Fair Disclosure Notice: I do not have a position in any of the aforementioned futures markets or securities related to this article. Saturday, July 7, 2012
Coffee Anyone?
My Personal Trade Plan

I've been following the monthly chart of coffee for quite some time. Most recent price action is in three waves to complete w.4 circle. Notice the long shadow tail as the 3-wave structure completed. That's selling pressure right at the .382 retracement of w.3 (not shown). I'm now looking for a 5-wave decline into 135.15 to end the sequence.

Turning my attention to the daily chart, a doji candle, represents indecision and also hints that the advance is complete.

The final chart of ticker symbol JO shows my target for the completion of w.5 circle at 32.50 where I will be looking to go long this market.
Best of Trading
======================================================================
ElliottwaveLive is not an investment advisory service or broker dealer. None of its contributors are registered investment advisors, licensed stock brokers or CTA's. The author may hold short term and long term positions in the futures, stocks and ETF's discussed herein. The author may also trade around those positions which may be in direct conflict with your positions. Complete trade disclosures of the contributor’s holdings are posted at www.elliottwavelive.blogspot.com. See Trader Disclosure. Trade at your own risk. The blog site, Newsletter and all other information, material and content accessible from this Site (collectively, the "Content") provided herein provides the context for market analysis with respect to a market's, a security or a commodity's general position utilizing the Elliott Wave Principle. The Content contained herein are the opinion and general comments of the author and is based upon information that Mr. Sinibaldi considers reliable but neither ElliottWaveLive nor he warrants it's completeness or accuracy and it should not be relied upon as such. Mr. Sinibaldi or ElliottWaveLive (collectively, referred to as “EWL”) are not under any obligation to update or correct any content provided on this website. Any statements and or opinions are subject to change without notice. The content and comments contained herein neither purports nor intends to be, specific trading advice. It has been prepared without regard to any particular person's investment objectives, financial situation and particular needs. Information should not be considered as an offer or enticement to buy, sell or trade.
A more and comprehensive Risk Disclaimer and Disclosure Statements is available within the left margin of this blog site.
Wednesday, December 14, 2011
Chart of the Day: First Solar - Chart patterns and fundamentals

First Solar
An elliotician would not have gotten too excited on 12/7/2011 when the company reported that they sold specific assets to Berkshire Hathaway. The stock spiked $5.78 ( refer to a daily price chart, not shown) before closing up a meager $1.88. I do know what Warren Buffet's strategy is for solar assets but judging from this chart, there may be more risk to the downside for this company and the industry as a whole before making a meaningful low.
Best of Trading
Wednesday, September 21, 2011
The Market Pulse
Humpty Dumpy Sat on a Wall...
Humpty Dumpty Had a Great Fall
Excuse me for finding humor in today's delayed FED announcement but by judging all the twitter comments, it seemed that most traders were sitting on the edge of their seats waiting for all the King's Horseman and all the Kings men to put Humpty Dumpy back together again.
The delay in the FOMC statement must have been due to the fact that Ben Bernanke, the King of the helicopter, was playing the nursery rhyme for minutes before the actual announcement due to the fact that he knows he has failed and the CNBC market headlines now read.... " Economy in Congress's Hands as FED Runs Out of Bullets".
So while Congress, the King's Men, try to put Humpty back together again, we wavers simply laugh and find the trading answers right on the charts.
The Nasdaq

Sunday's Heard on the Street video , subsequent edition of the Market Pulse and Before the Bell update, laid out the expectations calling for a top to be made in his market. If you want to see the progressions of analysis, I'd recommend reviewing those calls as the the top was nailed. The above chart is updated though today and by all indications, the Nasdaq has fallen off a wall.
While encouraging that w.(iv) support has been breached, to bolster the bearish case, I'll need to see price trade below w.(i) crest of 2201.5 and ultimately a break below w.x circle of 2108.25 to completely put a fork in this market. As a reminder, price action should confirm the count and trade should be impulsively to the down side in fast turnover as the count indicates that we're in a 3rd wave... the most violent and destructive wave within a five wave sequence.

And here is a 7200 tick chart. Notice I'm working w.3 of w.(iii) down and I'm setting critical resistance at 2280 to maintain the bearish view that minor w. 3 red is underway. As long as this level holds, expect the Nasdaq to lead the other indices lower.
S&P
Both scenarios that I laid out in Sunday's edition of Heard on the Street are still viable and as I mentioned that the move down from 1214.5 would determine which interpretation was correct.
Below are the two interpretations in no certain order of preference:

Price is approaching the 1148, ideal target for w.d circle which would be followed by another three wave advance to complete the triangle and w.4 red. While a decline below 1148 would not directly negate, prints below 1228.75would (see below).
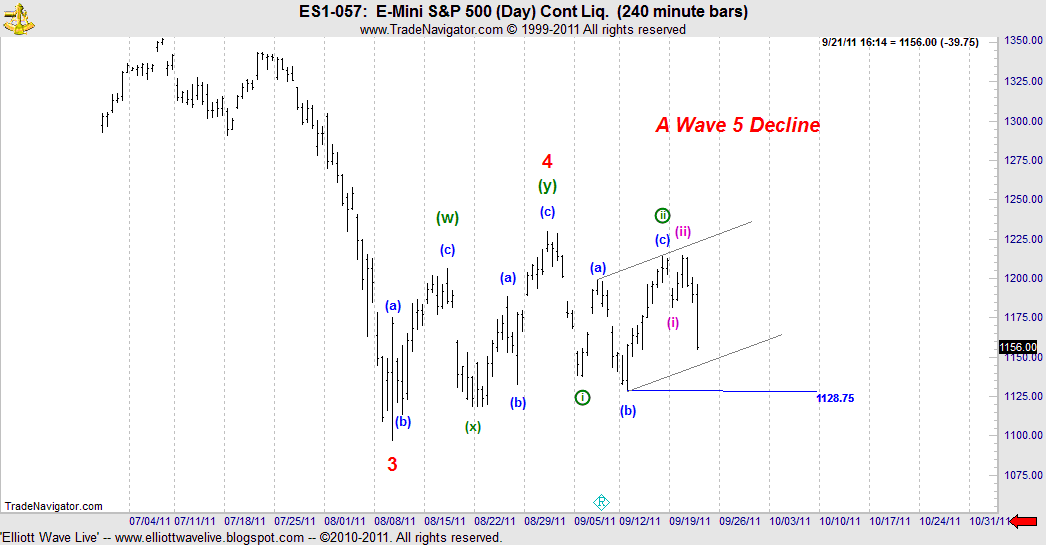
A break of the corrective price channel would bolster this view and a subsequent close below 1128.75 would effectively eliminate the triangle interpretation.
Best of Trading
Friday, August 19, 2011
Before The Bell: $ES_F

The following chart shows my preferred wave count where w.v is now underway. Yesterday, in the ES1 contract, the market made an initial five wave decline to complete w.i circle.

Likewise, the September contract also completed a five wave decline.
Although the market is down in the ON session, both charts have me looking up in w.ii that should take 2-3 trading days to complete. Of course there is always the possibility that the wave count is incomplete and w.(v) of w.i circle could continue to subdivide. I can make a case for another push down. So allow for further downside risk before w. ii of w. v circle begins.
In order to evaluate each scenario, the following are my key levels for today's trade:
SEPT CONTRACT:
Below 1117.5 : Negates immediate upside for w.ii development and the count would need to be revised as well as the retracement levels for the termination of w.ii.
Above 1117.5 : Critical support for current preferred wave count and short term bullish bias.
ES1 CONTRACT:
Simply, the opening print must be above 1128.25 to maintain current preferred wave count and short term bullish bias.
Let's see what develops.
Best of Trading
Subscribe to:
Posts (Atom)