Humpty Dumpy Sat on a Wall...
Humpty Dumpty Had a Great Fall
Excuse me for finding humor in today's delayed FED announcement but by judging all the twitter comments, it seemed that most traders were sitting on the edge of their seats waiting for all the King's Horseman and all the Kings men to put Humpty Dumpy back together again.
The delay in the FOMC statement must have been due to the fact that Ben Bernanke, the King of the helicopter, was playing the nursery rhyme for minutes before the actual announcement due to the fact that he knows he has failed and the CNBC market headlines now read.... " Economy in Congress's Hands as FED Runs Out of Bullets".
So while Congress, the King's Men, try to put Humpty back together again, we wavers simply laugh and find the trading answers right on the charts.
The Nasdaq
Sunday's Heard on the Street video , subsequent edition of the Market Pulse and Before the Bell update, laid out the expectations calling for a top to be made in his market. If you want to see the progressions of analysis, I'd recommend reviewing those calls as the the top was nailed. The above chart is updated though today and by all indications, the Nasdaq has fallen off a wall.
While encouraging that w.(iv) support has been breached, to bolster the bearish case, I'll need to see price trade below w.(i) crest of 2201.5 and ultimately a break below w.x circle of 2108.25 to completely put a fork in this market. As a reminder, price action should confirm the count and trade should be impulsively to the down side in fast turnover as the count indicates that we're in a 3rd wave... the most violent and destructive wave within a five wave sequence.
And here is a 7200 tick chart. Notice I'm working w.3 of w.(iii) down and I'm setting critical resistance at 2280 to maintain the bearish view that minor w. 3 red is underway. As long as this level holds, expect the Nasdaq to lead the other indices lower.
S&P
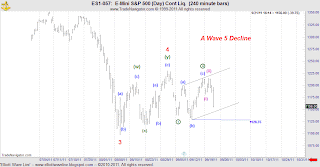
Both scenarios that I laid out in Sunday's edition of Heard on the Street are still viable and as I mentioned that the move down from 1214.5 would determine which interpretation was correct.
Below are the two interpretations in no certain order of preference:
Price is approaching the 1148, ideal target for w.d circle which would be followed by another three wave advance to complete the triangle and w.4 red. While a decline below 1148 would not directly negate, prints below 1228.75would (see below).
A break of the corrective price channel would bolster this view and a subsequent close below 1128.75 would effectively eliminate the triangle interpretation.
Best of Trading


No comments:
Post a Comment