An educational blogsite dedicated to teaching the Elliott Wave Principle, Fibonacci Ratio Analysis and Market Timing strategies. Primary focus is on the E-mini S&P. Please read the risk disclosures contained within this blog.
Thursday, September 22, 2011
Flash Update: ES_F
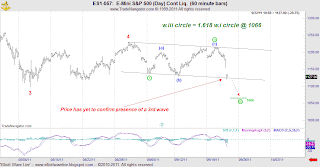
Last night I told readers that 1228 was the key downside level to watch. Based upon the ON session, the opening gap and the fact that price has traded below 1228 increases the odds are that the triangle interpretation will be eliminated and the other working interpretation ( a fifth wave decline) has prevailed.
At the 60 minute chart level we can see how price has touched the lower boundary of the price channel and that I'm working a w.iii circle count. However, just because I count it as such doesn't mean that I can confirm it due to the fact that price has yet to confirm the presence of a third wave i.e. by pushing through the lower boundary of the channel. Once it does, odds are that the internal structure is properly labeled and that an initial target of 1066 should be reached.
Let's see what happens.
Labels:
Contracting Triangle,
Price Channel,
Wave
Subscribe to:
Post Comments (Atom)


No comments:
Post a Comment