Showing posts with label Fibonacci. Show all posts

Thursday, May 23, 2013

Emini S&P 500

How yesterday may have unfolded.


The Bernanke testimony before the Joint Economic Committee, U.S. Congress had traders on the edge of their seats. At the time, I tweeted, "Spirited trading today" and the bulls were pushing the market higher. Possibly they drank from the punch bowl that Bernanke had spiked so many times before and it tasted different. 

Approximately an hour later, the breakout was in jeopardy. When the 240 minute bar closed, the message was clear. The breakout failed. Fittingly, Martin Pring describes this intraday pattern as a Pinocchio Bar.


Initially, several Fibonacci relationships lead me to believe that an argument could be made that a five wave sequence ended at what is now labeled as w.iii circle. However, given the loss of 1646.5 in the overnight session and subsequent price action I offer this count. Confidence remains against the figure 1632.75. 

Price has already advanced off the lows in what appears to be a corrective move.  That's what we would expect if a a w.2 or w.b was unfolding. 

While the sea may be full of red at the moment, it is in my opinion that a correction of the prior day's decline may be in order. 

Let's see what develops.

Best of Trading 


======================================================================
ElliottwaveLive is not an investment advisory service or broker dealer. None of its contributors are registered investment advisors, licensed stock brokers or CTA's. The author may hold short term and long term positions in the futures, stocks and ETF's discussed herein. The author may also trade around those positions which may be in direct conflict with your positions. Complete trade disclosures of the contributor’s holdings are posted at www.elliottwavelive.blogspot.com. See Trader Disclosure. 

Trade at your own risk. The blog site, Newsletter and all other information, material and content accessible from this Site (collectively, the "Content")  provided herein provides the context for market analysis with respect to a market's, a security or a commodity's general position utilizing the Elliott Wave Principle. The Content contained herein are the opinion and general comments of the author and is based upon information that Mr. Sinibaldi considers reliable but neither ElliottWaveLive nor he warrants it's completeness or accuracy and it should not be relied upon as such. Mr. Sinibaldi or ElliottWaveLive (collectively, referred to as “EWL”) are not under any obligation to update or correct any content provided on this website. Any statements and or opinions are subject to change without notice. The content and comments contained herein neither purports nor intends to be, specific trading advice. It has been prepared without regard to any particular person's investment objectives, financial situation and particular needs. Information should not be considered as an offer or enticement to buy, sell or trade. 

A more and comprehensive Risk Disclaimer and Disclosure Statements is available within the left margin of this blogsite.   
======================================================================

Fair Disclosure Notice: I do not have a position in any of the aforementioned futures markets or securities related to this article. 


Thursday, May 2, 2013

Does $USD - JPY Have Room To Run?


$USD-JPY  has progressed nicely and looks to have completed w.(3) of an ongoing advance that should unfold in five waves. Currently, w.(3) =2.618 w.(1). Should my assessment of this currency pair and preferred wave interpretation be proven correct then a fourth wave should be underway. Prints above 99.947 would negate my bias and be subject to re-evaluation of subsequent price action. 

According to the guidelines of elliott wave theory, 2nd and 4th waves typically alternate and are usually Fibonacci relationships to each other in both time and length. Since w.(2) unfolded in zig-zag, I'm looking for w.(4) to unfold in a time consuming sideways to down affair whose extent would target the most common Fibonacci relationship of w.(4) = .382 w.(3) or 91.04. Thereafter, a final impulsive rally should unfold in five waves to complete w.1 circle.

With regards to time, w.(2) took six months. Accordingly, w.(4) should be a Fibonacci multiple of w.(2) or put another way, w.(2) is a Fibonacci multiple of w.(4).  

Let's leave it there for now and see what develops.

Best of Trading


======================================================================
ElliottwaveLive is not an investment advisory service or broker dealer. None of its contributors are registered investment advisors, licensed stock brokers or CTA's. The author may hold short term and long term positions in the futures, stocks and ETF's discussed herein. The author may also trade around those positions which may be in direct conflict with your positions. Complete trade disclosures of the contributor’s holdings are posted at www.elliottwavelive.blogspot.com. See Trader Disclosure. 

Trade at your own risk. The blog site, Newsletter and all other information, material and content accessible from this Site (collectively, the "Content")  provided herein provides the context for market analysis with respect to a market's, a security or a commodity's general position utilizing the Elliott Wave Principle. The Content contained herein are the opinion and general comments of the author and is based upon information that Mr. Sinibaldi considers reliable but neither ElliottWaveLive nor he warrants it's completeness or accuracy and it should not be relied upon as such. Mr. Sinibaldi or ElliottWaveLive (collectively, referred to as “EWL”) are not under any obligation to update or correct any content provided on this website. Any statements and or opinions are subject to change without notice. The content and comments contained herein neither purports nor intends to be, specific trading advice. It has been prepared without regard to any particular person's investment objectives, financial situation and particular needs. Information should not be considered as an offer or enticement to buy, sell or trade. 

A more and comprehensive Risk Disclaimer and Disclosure Statements is available within the left margin of this blogsite.   
======================================================================

Fair Disclosure Notice: I do not have a position in any of the aforementioned futures markets or securities related to this article. 


Friday, April 19, 2013

Using Intraday Charts to Plot a Course for Gold

On April 16 I tweeted, " IMO, Gold 60 min chart looks like a B wave from HOD implying another move up may be in store. Prints above 1393.8 bolster my ST conviction."


When I mentioned this in real time what I was doing at the time was building my larger degree wave counts. As you will see, the Elliott Wave Principle allows me to set expectation for further price development. Let's take a look at the process.

As you know, corrective patterns burn time and tend to have overlapping waves. If the advance off the lows is to be labeled as a corrective advance, subsequent price action needs to meet the rules and guidelines of elliott wave but also the characteristics of wave personality should be met.

The B wave, as it turns out is an interesting development due to the fact that:

1. The pullback associated with w.b of w. (b) retraced .786 of w.a and unfolded in a 3-3-5 pattern ... a dead giveaway, according to the rules and guidelines of a flat correction. If this was true then prices would fall in five waves from the w.b crest to complete w.c of the larger degree w.(b) and prints below the origin of w.a would invalidate my interpretation.

2. You'll notice that w.(b) was also a deep correction suggesting that the larger advance that began from 1321.5 would also unfold as a larger flat. If so, counting a five wave advance from w.(b) low would complete the pattern and set the stage for either of three events:


  • a full retracement to new lows
  • a more complex correction would develop
  • prices would continue to advance proving my analysis wrong

Moving forward these are my expectations of what I am looking for. Should the market move in a manner contrary to my analysis then odds are that I am wrong.


I've placed reverse Fibonacci extensions on the chart which reflect levels that are of interest to me. While not labeled, price has already reached a point where w.(c) = w.(a) ... the most common relationship. Thus, the limits to hold onto this interpretation would lie below 1447.8.

I hope you found this lesson helpful. Let's leave it there for now. We'll pick up this lesson over the next few days to see how things turned out.


Best of Trading


======================================================================
ElliottwaveLive is not an investment advisory service or broker dealer. None of its contributors are registered investment advisors, licensed stock brokers or CTA's. The author may hold short term and long term positions in the futures, stocks and ETF's discussed herein. The author may also trade around those positions which may be in direct conflict with your positions. Complete trade disclosures of the contributor’s holdings are posted at www.elliottwavelive.blogspot.com. See Trader Disclosure. 

Trade at your own risk. The blog site, Newsletter and all other information, material and content accessible from this Site (collectively, the "Content")  provided herein provides the context for market analysis with respect to a market's, a security or a commodity's general position utilizing the Elliott Wave Principle. The Content contained herein are the opinion and general comments of the author and is based upon information that Mr. Sinibaldi considers reliable but neither ElliottWaveLive nor he warrants it's completeness or accuracy and it should not be relied upon as such. Mr. Sinibaldi or ElliottWaveLive (collectively, referred to as “EWL”) are not under any obligation to update or correct any content provided on this website. Any statements and or opinions are subject to change without notice. The content and comments contained herein neither purports nor intends to be, specific trading advice. It has been prepared without regard to any particular person's investment objectives, financial situation and particular needs. Information should not be considered as an offer or enticement to buy, sell or trade. 

A more and comprehensive Risk Disclaimer and Disclosure Statements is available within the left margin of this blogsite.   
======================================================================

Fair Disclosure Notice: I do not have a position in any of the aforementioned futures markets or securities related to this article. 


Friday, October 19, 2012

Corn May Be Ripe For Picking: Follow the Trade

Corn Set Up May Be Ripe For Pickings....


I've been following the impulsive move in corn for awhile and I believe that corn is nearing a position where a possible trade setup is developing. This set up comes on the heals of my previous work featured here and in my opinion may be one of high reward / low risk.

Note: The following work was completed last evening so there may be some progression in price that differs from these time stamped charts. 

Since I intend to take an actual position in the ETF, ticker CORN, rather than the futures contract, readers will have to use this blog post as a guide when labeling their CORN charts. 

Over the next few weeks, periodic updates will be made so that readers can learn how I'm actively using elliott wave in real time with regard to order entry, risk management and taking profit. It should provide an excellent learning experience!

The Analysis


At the weekly chart level, Corn is advancing impulsively in five waves, of which w. (5) is underway and  mature in the fact that only w.5 red is needed to complete the move before a meaningful top is in place.

A typical elliott wave Fibonacci target for a w.5 = .618 {w.1 - w.3} at 914^4


Turning to the daily chart level, I've labeled the subdivisions of w. 4 and waves w.i and w.ii circle of w. 5 appear to be complete. Should my analysis be correct, price progression should follow the general outline provided which becomes my trade plan for this market. 


The Set Up


Dropping to the 4 hr chart, my trade plan shown at the daily chart level now includes the internal subdivisions of the w.iii circle advance. 

In order for me to consider risking my money, I'm looking for an entry that limits and clearly defines my risk while maximizes my reward. 

Pre-Trade Conditions: 

1. Corn must sketch out the remainder of w.(i) without any overlap of 745^2 (w.i extreme). In doing so, a five wave advance occurs that doesn't break the rules for impulsive waves. 

2. According to Elliott, an actionary or trend wave (5 wave move) is followed by a reactionary wave that develops in 3 waves, therefore a w.(ii) counter trend move should occur. This corrective move CANNOT print below 732^4 or the count becomes invalid.

3. Ideally, the depth of the retracement of w.(i) will not go beyond .618 w.(i) which will be calculated after the w.(i) advance has terminated. 

We'll leave it there for now. My next post in this series will review that the pre-trade conditions were met;  describe w.(ii) in further detail and set forth the conditions of the actual trade. 

Until then.....

Best of Trading


======================================================================
ElliottwaveLive is not an investment advisory service or broker dealer. None of its contributors are registered investment advisors, licensed stock brokers or CTA's. The author may hold short term and long term positions in the futures, stocks and ETF's discussed herein. The author may also trade around those positions which may be in direct conflict with your positions. Complete trade disclosures of the contributor’s holdings are posted at www.elliottwavelive.blogspot.com. See Trader Disclosure. 

Trade at your own risk. The blog site, Newsletter and all other information, material and content accessible from this Site (collectively, the "Content")  provided herein provides the context for market analysis with respect to a market's, a security or a commodity's general position utilizing the Elliott Wave Principle. The Content contained herein are the opinion and general comments of the author and is based upon information that Mr. Sinibaldi considers reliable but neither ElliottWaveLive nor he warrants it's completeness or accuracy and it should not be relied upon as such. Mr. Sinibaldi or ElliottWaveLive (collectively, referred to as “EWL”) are not under any obligation to update or correct any content provided on this website. Any statements and or opinions are subject to change without notice. The content and comments contained herein neither purports nor intends to be, specific trading advice. It has been prepared without regard to any particular person's investment objectives, financial situation and particular needs. Information should not be considered as an offer or enticement to buy, sell or trade. 

A more and comprehensive Risk Disclaimer and Disclosure Statements is available within the left margin of this blogsite.   
======================================================================

Fair Disclosure Notice: I do not have a position in any of the aforementioned futures markets or securities related to this article. 


Thursday, September 27, 2012

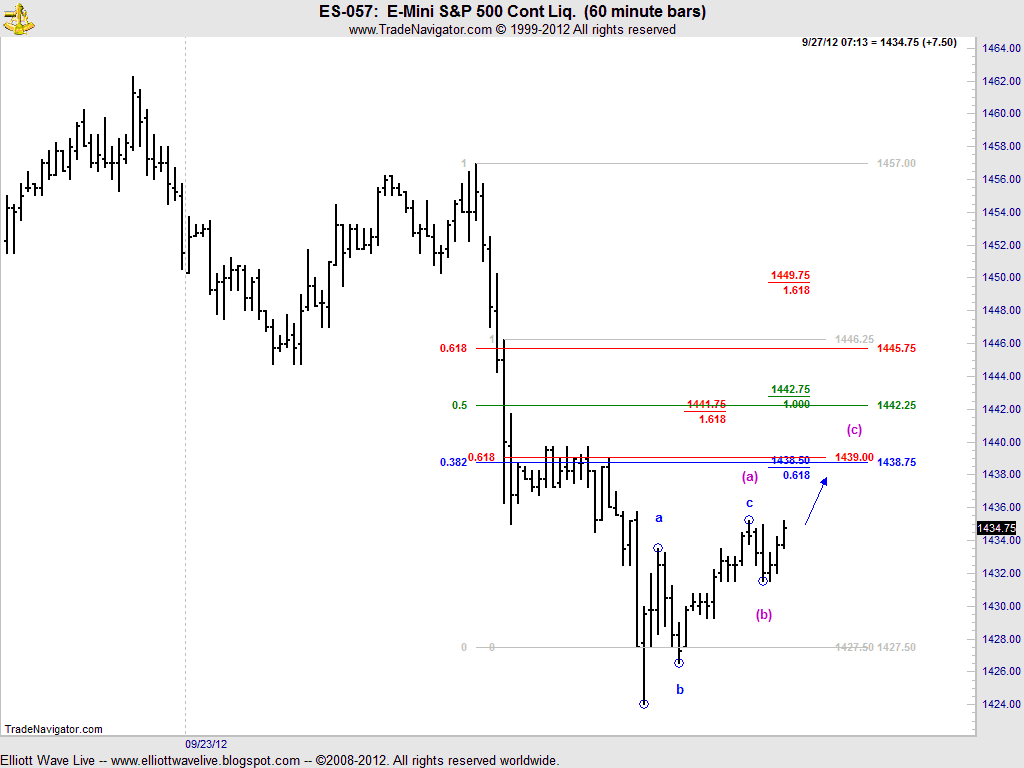
ES : Levels to Watch


I thought that it might be helpful to start publishing my Fibonacci levels and how they become applicable to my my wave interpretations. I'd like to hear some feedback from readers if you find this kind of information helpful. If so, I may start publishing levels on a daily basis.  

Here is a very early look at the ON session along with the Fibonacci levels that I'll be watching. My higher time frame interpretation requires another round of selling to complete the decline that began on 9/14/2012. As such, I have added a preliminary count that I feel best explains price action from yesterdays's low and that scenario. In doing so, I have my trade plan and expectations for what the market should do. Any deviation of wave personality and or a loss of 1431.5 would negate this view and require an adjustment of my count. 


Let's see what transpires and ...

Best of Trading


======================================================================
ElliottwaveLive is not an investment advisory service or broker dealer. None of its contributors are registered investment advisors, licensed stock brokers or CTA's. The author may hold short term and long term positions in the futures, stocks and ETF's discussed herein. The author may also trade around those positions which may be in direct conflict with your positions. Complete trade disclosures of the contributor’s holdings are posted at www.elliottwavelive.blogspot.com. See Trader Disclosure. 

Trade at your own risk. The blog site, Newsletter and all other information, material and content accessible from this Site (collectively, the "Content")  provided herein provides the context for market analysis with respect to a market's, a security or a commodity's general position utilizing the Elliott Wave Principle. The Content contained herein are the opinion and general comments of the author and is based upon information that Mr. Sinibaldi considers reliable but neither ElliottWaveLive nor he warrants it's completeness or accuracy and it should not be relied upon as such. Mr. Sinibaldi or ElliottWaveLive (collectively, referred to as “EWL”) are not under any obligation to update or correct any content provided on this website. Any statements and or opinions are subject to change without notice. The content and comments contained herein neither purports nor intends to be, specific trading advice. It has been prepared without regard to any particular person's investment objectives, financial situation and particular needs. Information should not be considered as an offer or enticement to buy, sell or trade. 

A more and comprehensive Risk Disclaimer and Disclosure Statements is available within the left margin of this blog site.   
======================================================================

Fair Disclosure Notice: I do not have a position in any of the aforementioned futures markets or securities related to this article.     

Wednesday, August 31, 2011

The Market Pulse


Consistent with Monday's call and the Before the Bell updated intraday chart presented on Tuesday, the emini SP retraced to 1192.5 and has now reached the 1227-28 target zone. With several Fibonacci levels and wave relationships clustered around today's high, as well as supporting technicals, it is possible to consider the advance from 1097 complete. However, the rise from 1192.5 doesn't count well and therefore I need to confirmation that a tradeable top is in place.


Looking at the 7200 tick chart of the September contract, I can argue that we have five waves complete from the top thus supporting my conclusions but I'd like to see a break of 1192.75 on the 60 min, daily session chart, to bolster the interpretation.

Any remaining bullish view clings to a break above today's high of 1229.75.

Let's see what happens.

Best of Trading