Showing posts with label Elliott Wave Trading. Show all posts

Friday, June 10, 2011

$ES-F: Intraday Update


Yesterday the Market pushed down to just above the first target for a w.i circle of 1271.25 and bounced. At the time of my previous post I indicated that I would have preferred for the market to reach the lower target as it would set up a better trading opportunity on a retest of the channel line. When that didn't happen I thought that w.(v) of w. i circle was complete as I could count a five wave decline and that w.ii was underway. The minor rally from 1273.75 - 1288.50 was weak and today's decline clearly opens the door to re-evaluate the internal structure of the decline from w.(iv). Given that the two upper targets have been met, look for a possible the test of 1257.

Look for further updates later tonight as well as my long term outlook published on Sunday.

Best of Trading

Tuesday, June 7, 2011

Today's Trade Provides a Practial Application on How to Use an Alternate Count

If the objective of every trade plan is to identify levels for buying and selling the market, then according to Robert Prechter Jr., "without Elliott, there appear to be an infinite number of possibilities for market action. What the wave principle provides is a means of first limiting the possibilities and then ordering the relative probabilities of possible future market paths" (1) thus the preferred wave count. An alternate count is nothing more than my second best wave count that also describes either the past, present or future movement of the market but in another context.

When I'm providing a wave interpretation for this blog, I'm always utilizing the preferred count. I remain open to evaluating price structure that is contrary to my preferred count and adapting an alternate wave count that realigns price with a known wave pattern. Should my analysis be unable to identify a clear count, readers are made aware of the uncertainty of the analysis.

Conversely, as traders, we do not have that luxury. The preferred wave count is my template for how I believe the trade should unfold. While I can't be certain that the market will oblige my best wishes, I MUST trade what I see NOT what I want to happen. Should the market's price action prove my preferred count wrong, either I get stopped out or the adoption of an alternate count allows me to stay with a trade, albeit defensively, depending on my entry, existing profit/loss and stop placement.

On June 5, 2011 call, ElliottWaveLive called for continued weakness in the eminis for Monday's trade.


At the 240 minute chart level, the close of yesterdays trade as well as the market technicals and subdivisions of the most recent wave called for for a three wave countertrend rally to end w.iv circle for today's trade.


A Hypothetical Trade


In the ON session, the market began to rally and traced out w.(A) and w.(B) providing the initial evidence that price action may be following the preferred count. A trade initiating a long trade at 1286 STOP 1283.5 (1 tick below the origin of w.(A) would be targeting the predetermined levels of 1298 - 1299 and unfold as a zig zag.


Price reached w.A circle at 1293.75 and began to fall. According to the previous chart, I was looking for a zig-zag to unfold and complete near the 50% retracement of 1288.5. While w.B circle actually was a flat correction, the fact that the corrective phase ended at the target and just below w.A circle provided a trader with the confidence in real time to stay in the trade. Here's why... the low of w.B circle was 1288.25 and overlapped the high of w.(A) at 1288.75...  another clue that the entire move is corrective.


Price then rallied from the w.B circle low to new highs.  At this point, price hit 1294.75 , where w.C circle = .618 w. A circle. The protective stop is moved to one tick below w.B circle at 1288. The retracement from 1294.75 was deep and took out the 1291 swing low... a warning sign that something may be wrong.

It's here that trading what you see must take over. Subsequent price action is choppy and contains numerous overlapping waves. My trade plan called for a five wave advance for w.C circle without overlap.... it's not.....  a second warning that the entire corrective move from 1283.25 to 1294.75 may be complete or that a more complex correction is unfolding. At a minimum,  I'm moving stops to just below the last swing low  of 1289.25 and lock in profit while looking to identify an alternate count that realigns me with the price action. I may also consider trailing my stop in a defensive manner under each higher swing low and let the market take me out of the trade.

In conclusion, the trade plan accurately identified an area suitable for buying the market, yet price has failed to reach our price objective at this time or do so in the manner that was called for. By having a clear expectation of what should unfold we remain flexible, objective and know where we're wrong as traders.

As part two of this lesson, I'll provide updated charts in a separate post so the trade can be followed.

I hope you found this information helpful and best of trading.


(1) Elliott Wave Principle, Frost and Prechter, page 94.

Sunday, June 5, 2011

Heard On The Street

ANNOUNCEMENTS

I'd like to ask my readership for a bit of advice. In July 2010, I started blogging with a focus on the emini S&P. My analysis now follow numerous Market's around the world and I would like to know if there are any particular market's of interest that you would like me to discuss more frequently or begin coverage of. Also, today's daily and weekly commentary are vastly different in the fact that the body of work is much more detailed as well as utilizes video. I would greatly appreciate it if I could get some suggestions as to how to improve the blog or what changes you would like to see that can add value. For those who are interested e-mail me at mikesinibaldi@yahoo.com or DM me at @elliottwavelive on Twitter.

Watch my weekly video wrap up where I'll be covering the emini S&P, the EUR-USD, Crude Oil and the FTSE 100.

Best of Trading


Wednesday, May 25, 2011

Chart of The Day: Goldman Sacs $GS... Time and Price Equality

The Elliott Wave Principle is a necessity for traders and investors because it's a powerful forecasting method that, when applied correctly, can  identify trade set ups in advance..... sometimes  weeks, months, even years in advance. An example is the January 21 2011 analogy for Goldman Sacs that forewarned investors of the eminent decline.


Fast forward to today and the pattern is unfolding as forecast. Should the analogy be spot on, a time and price relationship exits ... one of equality where w.(Y) = w.(W) at 37 weeks and a bottom should occur during the week of 10/7/2011 +/- 1 week. From a price perspective, w.(Y) = w.(W) at 111.24.

Although a potential trade set up is months away, I'll continue to monitor this security and make periodic updates.  I hope you found this information helpful and ...


Best of Trading

Thursday, April 21, 2011

$ES_F : An Intraday Perspective

Wave patterns that start in three waves often spell trouble as there are a number of possible outcomes. Often an analyst will not be able to clearly identify the wave pattern until the pattern has completed!

In last night's blog post, I stated that I am unable to make a high probability forecast. Nothing has changed as the market appeared to be on a verge of following though, but a negative Philly Fed report coupled with a shortened trading week has at least temporarily beaten back the bulls. 


The chart attached is purposely marked without subdivision wave labels as of w.3. Each diamond represents a three wave pattern. If 1335.75 isn't taken out, then the possibility exists that price may rotate back into the previous range in 3 wave setting up a triangle w.4.

Note: I have also noticed that certain commodities exhibit a similar pattern. Sticking with the all-in-one theme of markets rising / falling together based upon the USD movement, there is a possibility that commodities are projecting the next move for equities as they appear to be slightly ahead in terms of pattern development. 

Should 1335.75 be taken out to the upside, then the wave structure will be limited to a few counts.Look for me to expand on the commodity theme and updated wave counts for the emini's during this weeks edition of "Heard On The Street".

Best of Trading

Sunday, March 20, 2011

Heard On The Street: #ES_F #Gold #Oil #Currencies

Over the past few trading sessions, the S&P has managed to rally 41.75 points off the 1243.25 bottom before giving back 10.75 points of those gains to close at 1274.25 on Friday. The advance could be aattributed to the positive news that the UN voted in favor to establish a No Fly Zone in Libya and that the Japanese were making some progress in their battle to cool the earthquake damaged  nuclear reactors .... but from an Elliott Wave perspective, the rally appears corrective.

My March 13, 2011 update identified certain 3 cycle periods that called for the next market low to be made on 3/22 - 3/23 +/- 1 day. The question is, now that the S&P has rallied, will it roll over hard and put in the low that I called for?

To answer that question plus updated charts on the currencies market, Gold and Oil... watch this weeks video addition of Heard On The Street.


Best of Trading


Friday, March 18, 2011

ES_F: Flash Alert


There is evidence that the advance from 1243.25 to 1285 represents w.iv of w.1 down. The advance terminated just shy of the .50 retracement of w.iii circle. Price should not print above 1285, so that's key resistance. I am maintaining critical resistance at 1292.5 to allow for a slightly higher advance and a test of previous support .... now resistance (red line). However traders must be cautious in that this also marks the point where w.iv can't exceed this value by 1 tick to maintain the bearish view. A print above 129250 invalidates the interpretation  and I'm wrong.

Downside targets provided in the charts, as well as the 1.272 - 1.382 RF extensions from w.iv circle. These are not draw to maintain a clearer chart.

Best of Trading

Sunday, February 27, 2011

Heard On The Street: A Pause Before The Next Leg Down?

The Bulls were out on Friday as the market closed near it's highs of the day. The "buy the dip" trade returned but is the rally from 129250 going to lead to a new recovery high or was it a pause before the next leg down? Get the answer by watching this weeks video edition of Heard On The Street.

Best of Trading

Monday, February 21, 2011

Heard On The Street: #ES_F #Oil #Gold #Copper

The US Markets are closed today but you can still prepare for tomorrows trade by watching my video update of the S&P, Oil, Gold and Copper.


Best of Trading

Sunday, February 13, 2011

Heard On The Street


The last time we spoke I was looking for a new high in this market. Friday's price action carried the market to a new high... one that reached the targets stated in the 2/9/11 post of 1326.75 - 1329.25. If you review that post v.s. the wave count that I have presented here tonight, you will notice that I have changed the substructures of w.5 (red) to reflect greater proportionality between waves w. ii (purple) and w.iv (purple). Notice that the declines are harmonic in both price (14.03 and 13.07) and in time (15 and 14 bars) respectively. While the last few price bars from w.iv (blue) can be counted complete, I think that the market will extend higher in one final push.

Should the market extend higher it is important to note that currently w.(iii) < w.(i), therefore, w.(v) can't extend further than 1341.8 in $SPX and 1340 for  ES1-057 or w.(iii) will be the shortest wave and that would break the rules and guidelines of EWP. So from a trading perspective, we now have our lines in the sand where price MUST reverse or the count is incorrect.

We'll see what this week brings.


Best of Trading

Wednesday, February 2, 2011

The Market Pulse

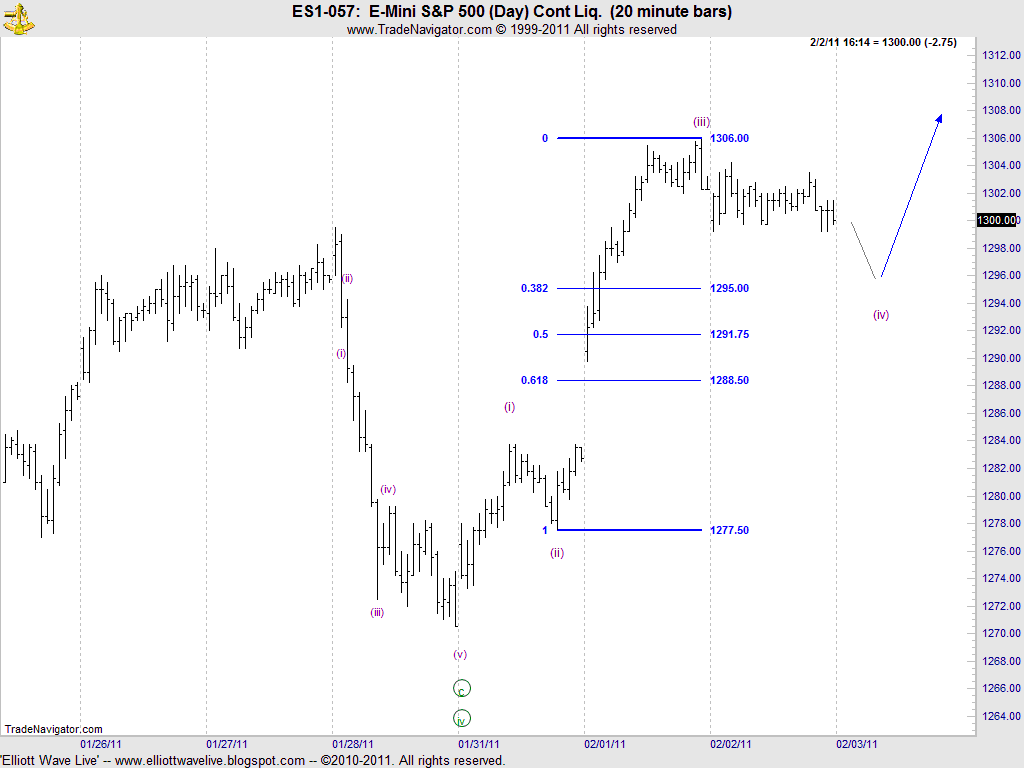
The last time we spoke I left readers with the possibility that w.(2) had ended at 129950 and the appropriate wave labeling as contained here at :

http://elliottwavelive.blogspot.com/2011/01/market-pulse-s-and-crude-oil.html

That's not what transpired as the wave count was blown out after two days of advancing prices. While I was absolutely WRONG, two valuable lessons can be learned.

1. From the labeling in Monday's post I showed a completed five wave decline which had me looking up as the Elliott rules and guidelines state that a five wave structure is followed by a three wave countertrend structure. However, in the case of my incorrect assessment of the market, what I should have been looking for is another five wave advance to new highs (more on this later). My point is... that even though I was wrong on the wave labeling, the minimal expectation was at least a three wave advance.... thus from a directional standpoint I was right.

Here's why:


If a trader acted on the completion of the decline from 129950 to 127050, then the probability of price movement in the desired direction (up) would be likely because only two possibilities existed:

i) That the decline ending at 127050 was a C wave or,
ii) that the decline was wave i.

Bottom line: Both scenarios called for higher prices giving a trader confidence in executing a trade. Traders using the wave principle should always look for a minimum of a three wave structure in the anticipated direction.

2. Waves are fractal in nature, i.e. that smaller wave structures make up larger wave structures. My failure to evaluate the daily higher time frame caused me to prematurely call the top.


Here is the previous daily chart showing that w.(2) had ended. While I can and certainly did make a case for this wave labeling, it was incorrect.

Here is the revised labeling.


Looking at the wave structure from w. iii circle to w.iv circle, the pattern is a three wave decline. That's corrective. Now looking back at the 60 minute chart level that was presented earlier, notice that the decline from 129950 to 127050 was w.c at the daily chart level. Had I looked at the 60 minute fractal and then reviewed the daily chart level, I would have had a better idea that w.(2) wasn't indeed completed.


Let's look at the current advance from 127050. The market has completed w.(iii) and w.(iv) is unfolding. According to the rules and guidelines of EWP, second and fourth waves follow an alternating pattern. Since w.(ii) was sharp, w.(iv) should be a sideways correction. That's whats occurring.

The most common Fibonacci relationship for fourth wave declines is .382 ;therefore, I'll be looking for a completed pattern near 1295 that will be followed by another five wave impulsive move to new highs.

I hope you have found this information helpful.


Best of Trading