Showing posts with label Emini SP. Show all posts

Wednesday, September 19, 2012

ES Update: After the Bell

Earlier today I provided an intraday update for the emini S&P where I was looking for a further decline in the market as show in the chart shown below.


To learn more about my initial thoughts, click here . 


Moving forward, the market put in a new high .25 above my w.(b) crest then proceeded to close weak for the session. I've adjusted the w.(b) label accordingly.

The above chart is a daily session charts that has been updated. 

A Hypothetical Trade

For tomorrow, my elliott trade plan is simple. 

(1) A loss of critical support bolsters my preferred wave count and negates any thought of an alternate triangular pattern developing. Downside targets may be achieved before any re-test of the 1468 high.

(2) If I was short this market from above 1459, my initial stop would have been placed above 1468. Based upon the close, I would move my stop to (1) tick above the w.(b) crest. Any advance above the w.(b) crest at this juncture would most likely produce an assault of 1468 and heighten the probability of a further advance to new highs in this market. 

Note: neither of the charts presented take into account the globex session therefore you should cross reference cited levels with those charts.

There is allot of news flow tomorrow so I'll be monitoring this one closely.  

Best of Trading

======================================================================
ElliottwaveLive is not an investment advisory service or broker dealer. None of its contributors are registered investment advisors, licensed stock brokers or CTA's. The author may hold short term and long term positions in the futures, stocks and ETF's discussed herein. The author may also trade around those positions which may be in direct conflict with your positions. Complete trade disclosures of the contributor’s holdings are posted at www.elliottwavelive.blogspot.com. See Trader Disclosure. 

Trade at your own risk. The blog site, Newsletter and all other information, material and content accessible from this Site (collectively, the "Content")  provided herein provides the context for market analysis with respect to a market's, a security or a commodity's general position utilizing the Elliott Wave Principle. The Content contained herein are the opinion and general comments of the author and is based upon information that Mr. Sinibaldi considers reliable but neither ElliottWaveLive nor he warrants it's completeness or accuracy and it should not be relied upon as such. Mr. Sinibaldi or ElliottWaveLive (collectively, referred to as “EWL”) are not under any obligation to update or correct any content provided on this website. Any statements and or opinions are subject to change without notice. The content and comments contained herein neither purports nor intends to be, specific trading advice. It has been prepared without regard to any particular person's investment objectives, financial situation and particular needs. Information should not be considered as an offer or enticement to buy, sell or trade. 

A more and comprehensive Risk Disclaimer and Disclosure Statements is available within the left margin of this blog site.   

======================================================================

CFTC RULE 4.41 - HYPOTHETICAL OR SIMULATED PERFORMANCE RESULTS HAVE CERTAIN LIMITATIONS. UNLIKE AN ACTUAL PERFORMANCE RECORD, SIMULATED RESULTS DO NOT REPRESENT ACTUAL TRADING. ALSO, SINCE THE TRADES HAVE NOT BEEN EXECUTED, THE RESULTS MAY HAVE UNDER-OR-OVER COMPENSATED FOR THE IMPACT, IF ANY, OF CERTAIN MARKET FACTORS, SUCH AS LACK OF LIQUIDITY, COMMISSION AND SLIPPAGE. SIMULATED TRADING PROGRAMS IN GENERAL ARE ALSO SUBJECT TO THE FACT THAT THEY ARE DESIGNED WITH THE BENEFIT OF HINDSIGHT. NO REPRESENTATION IS BEING MADE THAT ANY ACCOUNT WILL OR IS LIKELY TO ACHIEVE PROFIT OR LOSSES SIMILAR TO THOSE SHOWN.NO REPRESENTATION IS BEING MADE THAT ANY ACCOUNT WILL, OR IS LIKELY TO ACHIEVE PROFITS OR LOSSES SIMILAR TO THOSE DISCUSSED WITHIN THIS SITE, SUPPORT AND TEXTS. OUR POST(S), SHOULD BE USED AS LEARNING AIDS ONLY AND SHOULD NOT BE USED TO INVEST REAL MONEY. IF YOU DECIDE TO INVEST REAL MONEY, ALL TRADING DECISIONS SHOULD BE YOUR OWN. 
======================================================================

Fair Disclosure Notice: I do not have a position in any of the aforementioned futures markets or securities related to this article.     


Wednesday, October 12, 2011

The Market Pulse


Today's price action may constitute a reversal as show here in the CASH, but not as dramatic as in the emini S&P (see below).

There remain several possible counts due to the fact that there have been no discernible retracements from which to accurately draw any high probability conclusions.  While the chart above depicts a w.a termination, I can easily argue that the advance isn't complete. Therefore , it's best to step aside and wait for the market to show us some more pieces of the puzzle.


At the daily chart level of the emini's, today's session formed a bearish shooting star right at structural resistance. The candle implies a reversal as sellers entered the market. I'd like to see follow through and a closing of the gap to bolster the bearish case for a w. b decline.


My reasoning for the above statement is due to the fact that allot of weak shorts have their stops just above the 1214.5 and 1229.75 swing highs and as we all know ... the locals and bots love to hunt stops and inflict pain on the most market participants. Some shorts were flushed today as priced reached an intraday high of 1216. Th fact that I can't offer a high probability count at this juncture has be thinking that the potential for a reversal may be a head fake to the downside that will ultimately reach  a point where w.c = w.a at 1233. Only thereafter will the market lower.

Watch the ON session for clues.

Best of Trading


Tuesday, September 20, 2011

Before the Bell: Updated Chart of Nasdaq


From last night's edition of The Market Pulse, the above chart was presented. As you can see price has reached my target. Please refer to my original post for further details as additional upside may exist.

Interestingly, the emini S&P traded down last night and as I woke, found that a reversal has been made. To say the least, the move has got me on the edge of my seat. However neither market is confirming the other leaving this early strength questionable.

I'm watching for a bullish trap in either market.

let's see what happens.

Sunday, September 18, 2011

Heard on the Street

A Week of Confusing Price Action


Yesterday I spent 6 hours looking at multiple markets and concluded that there's allot of difficult chart patterns and questionable wave counts. Complex corrective phases are often the culprit, offering uncertainty until the wave pattern is nearly completed.

In this weeks video, I'm updating you with my counts for the emini S&P, Euro and Nasdaq.

Best of Trading


Sunday, September 11, 2011

Heard on the Street

In this weeks edition of Heard on the Street , I'm going to take a look at the emini S&P, Copper and the DAX.

Watch this video as I'm sure the coming weeks will be pivotal for each of these markets. More economic data comes out this week that may show that the economy continues to contract. The chart of Copper, a proxy for economic activity, is already flashing warning signs. As you will see, I fear the worst is yet to come.


Sunday, September 4, 2011

Heard on the Street: Do you trade what you see or trade what you think?

Do You Trade What You See or Trade What You Think?  


ANNOUNCEMENTS:
  • This weeks holiday edition will only focus on the emini SP Futures as I want everyone to know where this market is headed and the supporting evidence that leads to my conclusions. The videos will return to following several markets in the week ending 9/10/11.
  • By way of keeping you abreast of the progressions of my work... my blog-site has simply outgrow itself, has it's limitations and can't best serve the community of EWL 's followers.  As a result, I'm excited to share with everyone that I have formed SINIBALDI ANALYTICS, a private financial and investment publishing company and content provider of "The Market Pulse", "Heard on the Street" and "Global Gains" newsletters. The company is also engaged in providing educational trading services to long and short term traders.
  • I have begun working on the website www.elliottwavelive.com . The site will maintain access to free content, educational resources, the blog, a forum and offer premium services. Look for updates soon.


Sunday, August 21, 2011

Heard on the Street

ANNOUNCEMENTS:

As most of you know, I was planning on releasing my Global Gains Mid Year Forecast this weekend. Unfortunately, I will not be able to meet that deadline but I am actively working on the recording and will notify everyone when it's complete. One thing that readers should be looking forward to is that the forecast and subsequent recordings are using charts that were last updated on 8/12/20011. The recent volatility in global markets will surely be a formidable test of the accuracy of my market calls.

In the interim, we should have an interesting trading week ahead. Watch my weekly video and update of the Emini S&P and be prepared for what may lie ahead.


Best of Trading


Sunday, August 14, 2011

Heard on the Street


Does a Recent Fibonacci Expansion Series
Confirm the Bear Market Return?


Announcements:

  • On August 20,2011 I will be releasing my Global Gains -- Mid Year Forecast covering 20 markets (World indices, Currencies, Energy, Commodities and Metals) as well as some key intermarket relationships that you should be watching.
  • In September, watch for details on my new premium service Signal Watch RT ® -- a premium service -- providing insightful, real - time intraday elliott wave analysis. A complete list of features, benefits and special discount pricing will be available for current Twitter followers.
  •  Not a Twitter fan? You can get my most recent blog posts quickly and easily by "following my blog" or subscribing to my RSS feed. See the top right portion of my blog for details.

 The Market:

The Emini SP continues to follow my 2007-2011 analogy. It's interesting to listen to and read the bull/bear debate from the talking heads and other pundits. I'll stick with the charts!

Listen to my weekend video -- Heard on the Street -- to gain unfair advantage over other traders during the upcoming trading week.

Best of Trading


Sunday, August 7, 2011

Heard On The Street : Panic and Chaos

ATTENTION: New readers and loyal subscribers....

...Imagine the chaos and panic that may hit world markets --
 then decide how you'll protect your money on Monday...


Traders,

The past week has certainly been challenging to say the least and after the S&P downgraded U.S. debt, any glimmer of hope that traders had at Friday's close may evaporate.

What if the market is unable to catch a bid come Monday morning? Watching the market free fall without a plan to protect yourself won't be fun. After all, most portfolios haven't recovered since 2007 and the losses could be much greater this time around.

Since my July 17, 2011 call , I’ve been warning readers that the end of the bear market counter-trend rally was coming. In fact, my 2007-2011 analogy of the emini S&P demonstrated the fractal nature of the market, how the pattern would progress and the targets associated with the call. In fact, I've sent out multiple updates on Twitter and through my Monday- Wednesday-Friday blog posts keeping you abreast of the markets. 

I'm guessing that subscribers like you either protected yourself from the market's recent carnage or were already prepared to discuss it with your investment advisor and take advantage of it as a result of my forecasts ...

... but if my forecast didn't raise your eyebrows because you don't realize the benefits of Elliott Wave Analysis I can only hope that the events of this past week will change your mind.

Thursday’s 512 point Dow and 60 point S&P loss was just part the beginning, not the end. And if you are a bull, the losses you’ve taken so far could get much, much worse. 

What if you had know in advance, like my readers, that my target level for the S&P was 1166? What if you had that number in your pocket since the July 30, 2011 call and that the level was briefly surpassed on 8/4/2011 before staging a minor reversal.

It’s not too late for you to realize the educational benefits that I provide and the power of the Elliott Wave Principle. Sitting on your hands and waiting for the Central Banks around the world to come up with another ingenious plan is the worst move you could make.


Introducing Signal Watch RT  ® -- a premium service -- providing insightful, real - time intraday elliott wave analysis


There's one request that I've heard from readers again and again and that's more live, hands - on real-time wave analysis. Now if that sounds like something you might want to hear more about, Signal Watch RT ®, may be the solution you're looking for. You'll know what the market is likely to do and when it is likely to do it.

Next month, watch for a complete list of features and benefits and pricing but today I want to thank you personally for joining our community of  Elliott Wave Live readers. Roll up your sleeves, lock the door behind you, watch the video below NOW, then peruse my achieves (lower bottom right fold) and join my blog if you agree that my work is insightful.
Best of Trading,

Mike Sinibaldi 


Tuesday, August 2, 2011

The Market Pluse: An Interim Report


With two trading days in the books, heavy selling pressure has finally eliminated the alternate bullish running triangle interpretation for the Emini SP. The key area of critical support (1252.25) has been decisively broken leaving only bearish interpretations.

While today's close was fulfilling , in that the 2007-2011 analogy continues to provide a road map for anticipating where the market is headed, I would be remiss to inform readers that post pattern behavior is really important. The following chart is one of the two bearish interpretations. Where w.e actually ended is not locked in as of yet but it's really not required for the discussion below. What is, is the break of the lower boundary line and w.d.  


What I mean by post pattern behavior is that price has just broken out of a triangle and subsequent price action should confirm the pattern i.e. prices should swiftly decline in a thrusting manner with a minimum measured move in length equal to the widest length of the triangle (w.A). That would imply 1219.25 yet further potential exists to 1166.75 if you're viewing the pattern as a classical H&S. Should price action not react as the pattern implies, then something may be wrong with the analysis or the count itself.

Keep in mind that trading is like playing pool. If you've ever watch great pool players, they set up the table for their next shot. That's what we're doing now. First confirming that the analysis is right, then aligning with the trend.  In the coming days we'll eventually see a counter trend move that should be a great set up to ride the trend in the largest move down.

Tomorrow we have the jobs report. Given the dreadful economic news of late, a bad report could cause more technical damage to the market. We'll see what happens.

Best of Trading


Wednesday, July 27, 2011

Special Edition of Heard On The Street: 2007-2011 Analogy

Traders,

I was planning on covering my current count for the emini S&P in my upcoming Global Gains Mid Year Forecast but felt that the implication of what we've been discussing since July 17, are to big for readers to learn after the fact. Tonight, I'm providing you with the physical count to accompany the analogy. As a reminder you can watch the video in HD (use full screen... 720 p).

I will also make my regular post later tonight, covering the intraday price action that will supplement the larger wave count in thi video. If you have any questions, please DM me on Twitter or comment on the this blog post.

Best of Trading


Tuesday, July 19, 2011

The Moment of Truth for $ES-F


In light of today's move to the upside and the fact that the DOW and NASDAQ haven't confirmed the S&P wave overlap (see last nights post ), I thought I would at least show the running triangle interpretation for readers. However, it's showtime and the moment of truth has arrived as the Bulls MUST push the Market beyond 1354.5 (1352.75 the ES1 equivalent) to confirm that a triangle had completed AND make a new recovery high. Failure to print above 1354.5 (1352.75 equiv.) would forewarn, as a series of lower highswill be made possibly aligning the market as I described in my 2011 - 2007 analogy.

Let's see what happens.

Best of Trading

Sunday, July 17, 2011

Heard On The Street: $ES-F #Copper #Soybeans $EUR-USD

INTRODUCTION and ANNOUNCEMENTS:

Today the world finds itself at a crossroad of immense proportions. Possible European Sovereign Default and the U.S. Debt Ceiling /consequences of a possible downgrade remain atop of one's "Wall of Worry" list. Huge changes are coming in the near future whether we're ready for them or not. Many investors cling to the false hope that the economic storm is over and that their battered portfolios will recover from a decade of lost returns. As they will find out, it may be only just beginning.

Don't worry. The sky is not falling and the world is not coming to an end. In fact, the future has never looked brighter for traders and investors who take the initiative to "batten down the hatches" and position themselves properly in the market for the coming economic hurricane.

On December 20, 2010, I published my first edition of Global Gains where I released my market calls for 2011 with respect to the U.S, Asian and European major indices, Currencies, Metals and Energy. Whether you are a new subscriber or an existing follower, you may want to compare the market position as of  7/15/2011 for each market .... then compare it to my forecasts that were made over a half year in advance. Just click on the Global Gains link above. Every post on this site is dated and time stamped so you know the posts are authentic and NOT after-the-fact. As you will see, most of those calls are outright scarey while others invariably missed the mark. That's just the nature of long term forecasting.  

I'm not reviewing this information to impress you but to impress upon you the value of the Elliott Wave Principle. Secondly, it's nearly time to update my forecasts for the remainder of the year and I think that readers will find similar value in my forecasts. I'm contemplating presenting my forecast in a webinar format near the end of August.  Stay tuned for details!

Lastly, I launched Elliott Wave Live on July 2010 as a free service, consisting of analysis and commentary on the US, Europe and Asia-Pacific markets, commodities, currency pairs, stocks and ETF's using the Elliott Wave Principle, Fibonacci Ratio Analysis and Market Timing strategies. My primary focus has focused upon the E-mini S&P. My insight has been provided primarily through my blog site, video recordings and my Twitter account.

Shortly in the near future, I will be adding another level of service... a premium service, that provides more timely intraday analysis, charts and a greater in depth look at the markets. While I have not finalized all the details and cost of the subscription service, I will offer a free trial where you can kick the tires and slam doors to determine whether this service is right for you.  All will be explained in a short video presentation at a date to be determined.

THE MARKETS:

In this weeks edition of Heard On The Street I'll be covering the Emini SP, Soybeans, Copper and EUR-USD.

Best of Trading


Wednesday, July 13, 2011

The Market Pulse : News Headlines Dominate Trading

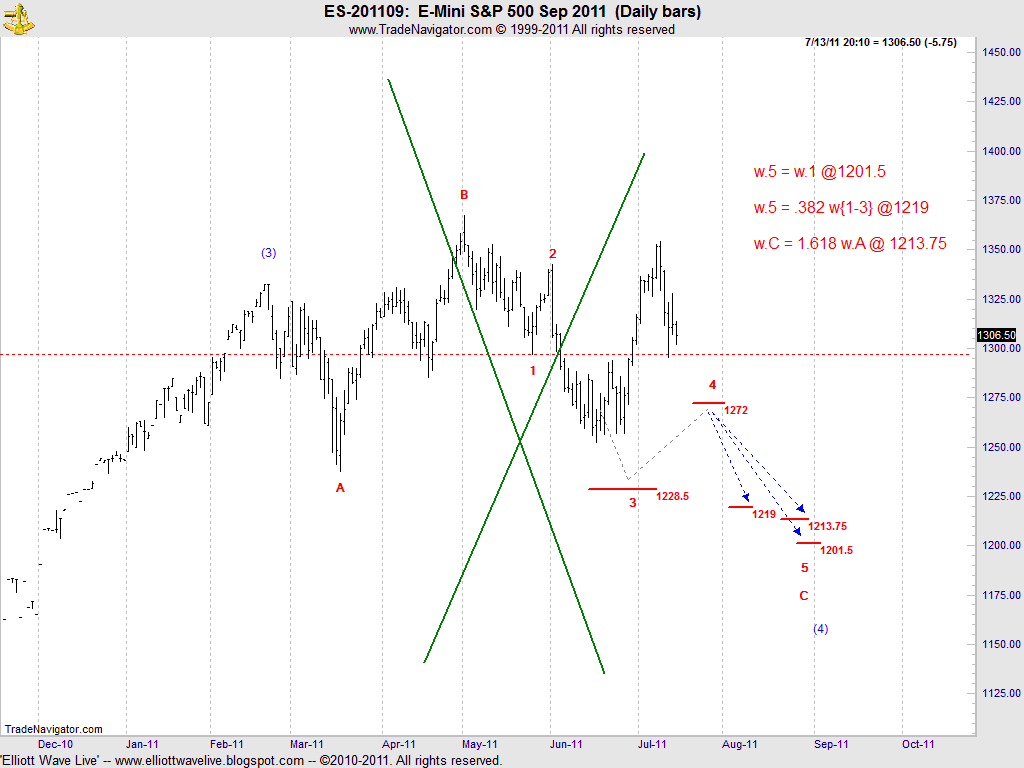
After a two week vacation I'm slowing getting back into the grove. Tonight I am going to briefly discuss the larger view and provide a new count at the higher time frames by weeks end.


The wave structure that I had been working, shown above, the expanded flat was negated as the June 16 low completed a three wave structure. In my 6/28 post  , I mentioned that it was necessary for the market to print below 1252.25 in order to complete a five wave sequence.  It never happened, thus eliminating the expanded flat interpretation.

Turning to the intraday charts, today's session was dominated by Bernanke's QE3 comments. For now, I think he is just talking up the market but be certain that he will "pump and print" if needed.
Within moments of opening his mouth, Gold hit a new high and the USD was pummeled again. However, Moody's dropped a bomb on the Bulls "Risk On" parade by placing the United States' Aaa rating on review for a possible downgrade. By the close, the "Bernanke pump" had been erased.

While stating the obvious up until this point, the fact is that the market remains in a sideways trading range with wild directional swings.  There's allot of noise right now so staying focused on singular waves can save you allot of pain. 

Two counts that point down :


From the chart, the E mini SP appears to have made a five wave sequence from 1352.75 and have traced out a countertrend three wave affair that ended at 1327.75. Given the 5-3 sequence... at the minimum, another five wave structure MUST follow that could draw price to 1283.75.


Today's high could also be interpreted as w. a of a larger corrective pattern. Once complete , it will be followed by a five wave affair. It's to early to determine if this scenario will play out. Therefore, allow for the possibility of modestly higher prices before more selling pressure. A loss of 1295.25 would bolster the more immediate bearish view.

Best of Trading

Sunday, June 26, 2011

Heard On The Street

Announcements:

1. I will be vacationing from June 28 - July 12 and the last blog post will be on Monday June 27, 2011.  Regular post will resume on July 13.  

2. During my analysis of Oil I failed to mention that the charts used that pertaining to my comments were "forward contracts " of CL3-057 because of limited date on the QM mini Gold forwards.

As I reviewed the markets on Saturday morning I realized that many are on the brink of big moves. Volatility has picked up and as traders we welcome it. In this weeks video edition of Heard On The Street my hope is to identify the key areas where significant opportunities may exist. As always, these are my opinion and not a trade recommendation. You should read my complete Risk Disclaimer and Disclosure Statement contained on the left hand side of the blog.

The markets that I'm covering are: Emini SP futures, Corn, Wheat, Soybeans, Gold, CRB Index, Gold, Oil and the EUR-USD.

Best of Trading