Showing posts with label USD. Show all posts

Friday, November 1, 2013

Elliott Wave, Halloween and Day Trading the S&P 500

The last two trading session were spooky. Ha? I hope tonight found you in a safe place with your family and if you happen to be "trick or treating" then you are going to love what I had in store for you ...

Now how about a treat?
Yesterday I gave up some Halloween treats on the S&P 500, Gold and the US Dollar and showed what Elliott Wave, Halloween and Day Trading the S&P 500 have in common.

Click here to learn more before this market scares the be-jesus out of you. 

Best of Trading

Mike Sinibaldi


P.S. Please do me the favor and let me know what you think by sharing your thoughts with a friend or commenting on the page itself.

P.S.S. It scares me even more to think about the valuable market insights you are missing when you don't log-in to my website every day and read my Elliott Wave Brief every morning. SO if you are not a FREE subcriber to mikesinibaldi.com then click here to gain immediate access.

Thursday, September 13, 2012

Don't Get Fooled: USD


For all the market pundits who maintain a bullish count and those who think the USD is doomed.... this quarterly chart is my gift for everyone to ponder and draw your own conclusions. 


Best of Trading

======================================================================
ElliottwaveLive is not an investment advisory service or broker dealer. None of its contributors are registered investment advisors, licensed stock brokers or CTA's. The author may hold short term and long term positions in the futures, stocks and ETF's discussed herein. The author may also trade around those positions which may be in direct conflict with your positions. Complete trade disclosures of the contributor’s holdings are posted at www.elliottwavelive.blogspot.com. See Trader Disclosure. 

Trade at your own risk. The blog site, Newsletter and all other information, material and content accessible from this Site (collectively, the "Content")  provided herein provides the context for market analysis with respect to a market's, a security or a commodity's general position utilizing the Elliott Wave Principle. The Content contained herein are the opinion and general comments of the author and is based upon information that Mr. Sinibaldi considers reliable but neither ElliottWaveLive nor he warrants it's completeness or accuracy and it should not be relied upon as such. Mr. Sinibaldi or ElliottWaveLive (collectively, referred to as “EWL”) are not under any obligation to update or correct any content provided on this website. Any statements and or opinions are subject to change without notice. The content and comments contained herein neither purports nor intends to be, specific trading advice. It has been prepared without regard to any particular person's investment objectives, financial situation and particular needs. Information should not be considered as an offer or enticement to buy, sell or trade. 

A more and comprehensive Risk Disclaimer and Disclosure Statements is available within the left margin of this blog site.   


======================================================================
Fair Disclosure Notice: I do not have a position in any of the aforementioned futures markets or securities related to this article. 


Thursday, June 7, 2012

A Quiz That Gives A Hint For The Market

 The Key For Equity Market Movements


In just 5 seconds, tell me whether the wave pattern from the top is impulsive or a correction. Then try labeling the pattern. 

Additional comments will be provided once everyone has had an opportunity to respond or take mental notes.

Best of Trading

Sunday, June 3, 2012

You Decide The Fate of the Markets

Richard Russell stated in his newsletter, “I believe that the bear signal is telling us that Greece will default, to be followed by Spain, and the whole Eurozone may then fall apart.I consider the April-May action to be a continuation of a primary bear market that started on October 9, 2007, with the Dow at 14,164.53.  We are now dealing with the latter part of the primary bear market that began in 2007.”

While I don't subscribe to the newsletter, I did find myself in agreement with the quote. Everybody that follows me knows that I'm a long term bear and my view hasn't changed. It's lonely taking a contrarian view, especially with thinly traded markets and the manipulation of markets by the FED. Does it concern me that the FED may never stop printing and my shorts may get blown out? Certainly, but surely most readers would agree that the results of massive stimulus around the world hasn't really solved most macro problems. While QE1 and QE2 and Operation Twist has been supportive to US markets... each  has failed to push the broader market to new highs. Europe is in full crisis mode that threatens to take down global markets like dominos. China exports the majority of their goods to Europe. Australia is highly dependent on China for material purchase. Pundits say the  US is isolated from the Euro contagion. I ask how, since industrial multinational earnings will surely miss.

I wanted to briefly share what I'm looking at. Just charts... not allot of detailed commentary..... for you to evaluate. Enjoy

DOW


Dow upper resistance trendline holding yet I'm watching for the possibility that the same fractal pattern as shown in the shaded box may play out leading to another major advance. 


CRB Index


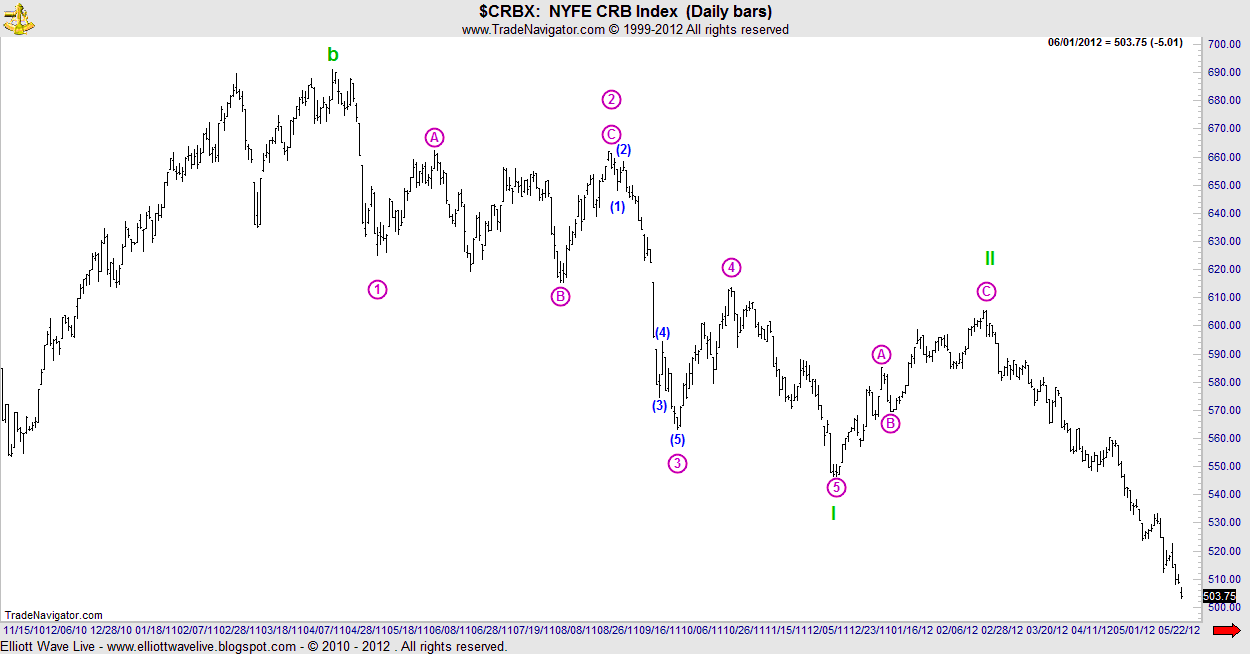
Working cycle w. III with much further downside risk. If equities experience a similar fate as last summer, commodities should continue their decline (See US Dollar, all in one chart.)


US Dollar


The Dollar has been building a base that supports the overall decline of commodities.


S&P vs CRB (All In One)


Notice commodities declined after each equity peak. However, as the the wave count of the CRB chart (above) indicates, a major top is in and explains why commodities continue their decline while equities were able to make a modest recovery highs.


Baltic Dry Index


VIX


The VIX is making a rounded bottom and I expect allot of volatility as price works up the lower right side of the arc. The H&S pattern is only the beginning. This view would be consistent with a more serious decline in equities. 


EUROPE


Wednesday, July 13, 2011

The Market Pulse : News Headlines Dominate Trading

After a two week vacation I'm slowing getting back into the grove. Tonight I am going to briefly discuss the larger view and provide a new count at the higher time frames by weeks end.


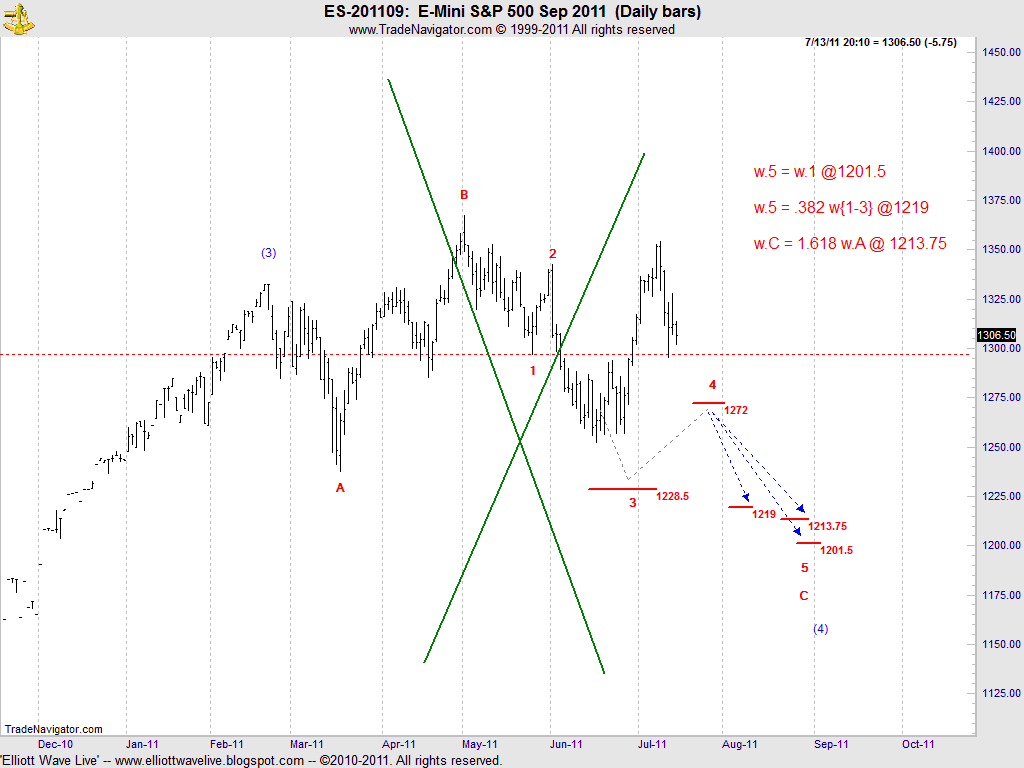
The wave structure that I had been working, shown above, the expanded flat was negated as the June 16 low completed a three wave structure. In my 6/28 post  , I mentioned that it was necessary for the market to print below 1252.25 in order to complete a five wave sequence.  It never happened, thus eliminating the expanded flat interpretation.

Turning to the intraday charts, today's session was dominated by Bernanke's QE3 comments. For now, I think he is just talking up the market but be certain that he will "pump and print" if needed.
Within moments of opening his mouth, Gold hit a new high and the USD was pummeled again. However, Moody's dropped a bomb on the Bulls "Risk On" parade by placing the United States' Aaa rating on review for a possible downgrade. By the close, the "Bernanke pump" had been erased.

While stating the obvious up until this point, the fact is that the market remains in a sideways trading range with wild directional swings.  There's allot of noise right now so staying focused on singular waves can save you allot of pain. 

Two counts that point down :


From the chart, the E mini SP appears to have made a five wave sequence from 1352.75 and have traced out a countertrend three wave affair that ended at 1327.75. Given the 5-3 sequence... at the minimum, another five wave structure MUST follow that could draw price to 1283.75.


Today's high could also be interpreted as w. a of a larger corrective pattern. Once complete , it will be followed by a five wave affair. It's to early to determine if this scenario will play out. Therefore, allow for the possibility of modestly higher prices before more selling pressure. A loss of 1295.25 would bolster the more immediate bearish view.

Best of Trading

Saturday, June 18, 2011

Head On The Street: #USD, $ES-F, #CrudeOil

The Market's are certainly more volatile. In the coming weeks we'll know whether the most recent declines are corrective or the resumption of the Bear Market. In the meantime, find out where Crude Oil, the USD and the S & P are headed.


Friday, June 17, 2011

USD : A thought


The most recent price action for DX-F can be interpreted as either bullish or bearish at the higher time frames. Here's the 120 min. chart level for consideration. I'll be devoting a considerable amount of time on the USD and Euro during this weeks video edition of Heard On The Street.

Best of Trading


Tuesday, May 24, 2011

Chart of The Day: $EUR-USD

Today's chart of the day is the $EURO_USD. As many of you know, the broader analogy that I have been using to guide me is that markets are moving as one. Simply put, trading opposite the direction of the USD with regards to equities and commodities or in the same direction with the $EURO_USD pair.


At the daily chart level, the pair is working what I believe is w.iii cicle. At a minimum, w.iii should obtain equality at 1.3453 but the most common fibonacci relationship exists at 1.2902.


Here is the same chart indicating that support below the market is between 1.3653- 1.3769.


At the intraday chart level, w.iv of w.(i) has competed near the .50 retracement of w.iii and my expectation for today is for a final push down where w.v= .618 {w.(i-iii)} at 1.3794 which is in agreement with the support levels noted at the daily chart level.

I hope you found this information helpful and best of trading.


Thursday, March 3, 2011

Chart Of The Day: The Gold/Oil Ratio


Gold and Crude Oil have been on a tear since the 2009 low.  Readers of EWL were most recently updated on my bullish stance towards these markets while some elliotticians had called a top in Gold and Oil. 

The wave principle provides the context for determining the markets position and it also gives you an way of determining the probability of a future direction for the market. Today's chart of the day features a the Gold/Oil Ratio.


The significance of this chart gives traders an unfair advantage over other traders by it's ability to forecast the US economy, the USD, Commodities and direction of the equity markets.

Print out this chart and label the corrective wave structure from the high of 27.8... then compare it to my elliott wave count as I revisit the chart of the Gold/Oil Ratio and show readers how it fits into my macro view for Gold, Oil, USD, Commodities and the S&P.

You'll find all that in my special video edition of "Heard On The Street", published on March 6, 2011.

Best of Trading

Wednesday, February 23, 2011

The Market Pulse: USD, Commodities and ES_F

So, the political unrest in the Middle East has spooked the Market. If you watched my weekly video featuring the S&P, Gold, Oil and Copper... the only minor surprise was that the S&P turned tail a bit below my target area of 1346.25-1347.25.  I've received many e-mails from subscribers asking if I'm still looking higher or whether the top has been made for the year in US equities.

Here's a hint! It's still all about the US Dollar.


For many weeks, I have spoken about the "all in one" concept where commodities and equities move inversely to the USD. Above are the charts of several commodities and their inverse relationships to the USD. You might argue that my case is weak as several commodities such as Copper, Soybeans, Corn and Wheat are on the decline even as the UDS falls.


I offer the weekly chart of the CRB Index that shows that the larger degree trend is still up and the only reason for the short term disconnect between the USD and commodities is due to the the w.(4) decline. Thereafter, commodities will resume their assent. Could a case be made that the top is in, i.e. w. V (green)? Certainly, but we don't have any evidence to support such a claim. There are no trendline breaks, nor violation of structural support. We have to look higher.


That brings me to my opening statement regarding the USD's role in anticipating a trend change in equities.

BOTTOM LINE: The USD continues to coil. When markets continue to go sideways, and you have to force a wave count, you're asking for trouble. There is no way that I can make a bullish case for this market if a triangle is forming. At best, I see an advance to w.e and then further selling pressure.  Without a break of 86.55, I remain bearish on the USD. If my analysis is correct, that implies that the run in commodities and equities MAY NOT BE OVER!!

The Market has a habit of inflicting maximum pain to market participants when nobody expects it. When you think about all the manipulation that is going on, how fitting it would be to run stops of all the late to the party bulls and then turn right around and burn all the Bears that re-entered the market thinking that the market had made a major turn.  I'm keeping this thought in the back of my head as the wave structure unfolds to the downside.

When a market weakens, watching market leaders can tell us allot about the health of a market.  Leading stocks like AAPL, NTFLX, and AMZN have struggled this week. NYSE volume rose across the board, logging back to back distribution days in the S&P and DOW. Since Jan. 1, 2011, there have been 7 distribution days indicating that institutions are selling.


So here's how I'm viewing the market. The market has made an initial five wave decline. Since there are no channel lines and structural support that have been broken, I can't fully embrace the fact that w.2 circle has ended. I've labeled the chart accordingly. 


Here are the internal subdivisions of the recent decline. Regardless of whether a top is in place, what's important is that I am expecting a countertrend rally in the ON and daily session. Look for failures between 131850- 132025, followed by another round of selling.


Best of Trading