Monday, February 28, 2011

The Market Pulse


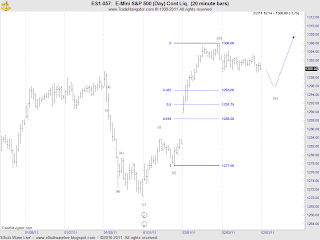
The last time I spoke to readers, the following chart showed my operative and alternative wave counts. At the conclusion of today's trade, I can eliminate the alternative wave count as price advanced beyond the 1.618 RF of wave b circle.


That being said, the strength of today's move was a bit of a surprise, as price exceeded my upside target of
1323.75 - 1325.5 and advanced to 1329 before making a minor three wave decline. The next area of resistance above the is 1332.25. You should note that I have made some changes to the wave count for w.ii circle based upon today's price action. I've labeled the advance as a double three where w.(y) of w.ii circle may have terminated today and if so we should see an immediate decline in five waves if this count is correct.

Notice the Detrend Osc. has a established trendline and diverged as price made new highs. This suggests that the rally is very mature in it's structure or it had already completed it's advance.

If w.ii circle has been struck, then the osc. should fall. Should it push higher and test the trendline during the ON session or tomorrow's trade, price should move higher to where w.(y) = w.(w) at 1337.25. If this scenario prevails, then the rules of EWP apply, in that w.ii circle can't carry beyond the origin of w.i circle if the wave count is correct. Therefore, I'm setting critical resistance at 1343. A print above 1343 negates either wave interpretation.


I hope you found this information helpful.

Best of Trading

Sunday, February 27, 2011

Heard On The Street: A Pause Before The Next Leg Down?

The Bulls were out on Friday as the market closed near it's highs of the day. The "buy the dip" trade returned but is the rally from 129250 going to lead to a new recovery high or was it a pause before the next leg down? Get the answer by watching this weeks video edition of Heard On The Street.

Best of Trading

Friday, February 25, 2011

ES_F: Alternate Count


I didn't expect a move of this magnitude from the low so I came up with this alternative. Could this wave count better explain the price action that we are seeing today? Should this be correct, the target is the .618 retracement and the 1.618 RF of w.b circle (132325 - 1325.5)

View my operative wave count . Notice that today's move up would be very large in magnitude to comfortably interpret the move from 129250 as a larger w.a.

I'll be working on the next issue of "Heard On The Street" over the weekend and I hope to have gotten a better handle on the count. Until then...

Best of Trading

S&P Update and Trade Plan


As most of you know, I like to wait for confirmation that a trend change has occurred before placing my money at risk. The updated chart above shows that a five wave decline has occurred that should lead to a three wave advance.. a counter trend move. Note that I'm not calling the top for the year here, just a potential trade set up. For more detailed insight on the ES_F current market position click here. For today, I'm looking to identify the termination point of the wave B trigger to go short the market. I'm initially looking for failures surrounding 1317, the .5 retracement of the most recent decline from 1343 to 129250.

I have found that trading waves 3,5, and wave C are the best waves to trade... each are set up by the "trigger waves" of 2,4 and wave B.


Looking at the five minute chart level, w.c = w.a at 1318. So 1317-1318 is agreement. That's my area to enter the market and ride the trend in w.iii circle down.

Best Of Trading

Wednesday, February 23, 2011

The Market Pulse: USD, Commodities and ES_F

So, the political unrest in the Middle East has spooked the Market. If you watched my weekly video featuring the S&P, Gold, Oil and Copper... the only minor surprise was that the S&P turned tail a bit below my target area of 1346.25-1347.25.  I've received many e-mails from subscribers asking if I'm still looking higher or whether the top has been made for the year in US equities.

Here's a hint! It's still all about the US Dollar.


For many weeks, I have spoken about the "all in one" concept where commodities and equities move inversely to the USD. Above are the charts of several commodities and their inverse relationships to the USD. You might argue that my case is weak as several commodities such as Copper, Soybeans, Corn and Wheat are on the decline even as the UDS falls.


I offer the weekly chart of the CRB Index that shows that the larger degree trend is still up and the only reason for the short term disconnect between the USD and commodities is due to the the w.(4) decline. Thereafter, commodities will resume their assent. Could a case be made that the top is in, i.e. w. V (green)? Certainly, but we don't have any evidence to support such a claim. There are no trendline breaks, nor violation of structural support. We have to look higher.


That brings me to my opening statement regarding the USD's role in anticipating a trend change in equities.

BOTTOM LINE: The USD continues to coil. When markets continue to go sideways, and you have to force a wave count, you're asking for trouble. There is no way that I can make a bullish case for this market if a triangle is forming. At best, I see an advance to w.e and then further selling pressure.  Without a break of 86.55, I remain bearish on the USD. If my analysis is correct, that implies that the run in commodities and equities MAY NOT BE OVER!!

The Market has a habit of inflicting maximum pain to market participants when nobody expects it. When you think about all the manipulation that is going on, how fitting it would be to run stops of all the late to the party bulls and then turn right around and burn all the Bears that re-entered the market thinking that the market had made a major turn.  I'm keeping this thought in the back of my head as the wave structure unfolds to the downside.

When a market weakens, watching market leaders can tell us allot about the health of a market.  Leading stocks like AAPL, NTFLX, and AMZN have struggled this week. NYSE volume rose across the board, logging back to back distribution days in the S&P and DOW. Since Jan. 1, 2011, there have been 7 distribution days indicating that institutions are selling.


So here's how I'm viewing the market. The market has made an initial five wave decline. Since there are no channel lines and structural support that have been broken, I can't fully embrace the fact that w.2 circle has ended. I've labeled the chart accordingly. 


Here are the internal subdivisions of the recent decline. Regardless of whether a top is in place, what's important is that I am expecting a countertrend rally in the ON and daily session. Look for failures between 131850- 132025, followed by another round of selling.


Best of Trading

Monday, February 21, 2011

Heard On The Street: #ES_F #Oil #Gold #Copper

The US Markets are closed today but you can still prepare for tomorrows trade by watching my video update of the S&P, Oil, Gold and Copper.


Best of Trading

Wednesday, February 16, 2011

The Market Pulse


The last time we spoke I offered this chart of the ES_F market where I expected a decline to 132150 or a sideways move to complete w.iv (blue). As it turned out, the market declined to 132225.


If w.iv (blue had ended yesterday, then an impulsive wave should follow. Today's action was not a disappointment.  Above is the operative wave labeling. The move from 132225 to 1336 appears to be in five waves. Under this scenario, prices will fall in the ON session or early on into tomorrows trade.


However, I can also make a case that today's price advance was in three waves (alternate count) and that today's price advance completed w.B of w.iv (blue) that is still unfolding. If the alternate count prevails, I expect prices to decline to 1317-131850.

In conclusion, both interpretations anticipate a near term decline.

Best of Trading

Tuesday, February 15, 2011

The Market Pulse


W.v of w.(v) of w.5 continues to subdivide. Nothing that transpired yesterday changes my view of this market as depicted in this weekends edition of Heard On The Street however I wanted to show readers what transpired after the market closed.


Here's the chart for the March contract. The sell off after 4:15 pm est along with the sideways price movement for the most part of yesterdays session looks like a complex combination correction is unfolding. If this count is correct, the remainder of w.iv (blue), i.e w.y can unfold in a triangle whereas price will move sideways or in a zig zag where price would decline to 132150... a .382 retracement of w. iii.

Certainly this muddles the count against either the $SPX or ES1-057 charts as they appear to be moving higher although awkwardly.

Let's see how the market opens.

Best of Trading

Sunday, February 13, 2011

Heard On The Street


The last time we spoke I was looking for a new high in this market. Friday's price action carried the market to a new high... one that reached the targets stated in the 2/9/11 post of 1326.75 - 1329.25. If you review that post v.s. the wave count that I have presented here tonight, you will notice that I have changed the substructures of w.5 (red) to reflect greater proportionality between waves w. ii (purple) and w.iv (purple). Notice that the declines are harmonic in both price (14.03 and 13.07) and in time (15 and 14 bars) respectively. While the last few price bars from w.iv (blue) can be counted complete, I think that the market will extend higher in one final push.

Should the market extend higher it is important to note that currently w.(iii) < w.(i), therefore, w.(v) can't extend further than 1341.8 in $SPX and 1340 for  ES1-057 or w.(iii) will be the shortest wave and that would break the rules and guidelines of EWP. So from a trading perspective, we now have our lines in the sand where price MUST reverse or the count is incorrect.

We'll see what this week brings.


Best of Trading

Friday, February 11, 2011

The Chart of The Day: KOSPI Rally Ending?

A possible change of trend for the KOSPI has taken place. To find out where prices are headed, view this brief video.

Best of Trading 

Wednesday, February 9, 2011

The Market Pulse


The last time we spoke on 2/7/11, I was looking for a decline on Tuesday to complete w.iv of w.(v) and for w.v to terminate between 1326.75 - 1329.25. The market traded near my targets to 132225 and leading up to today's market open, the Million Dollar question is whether the 132225 close completed w.5 red or if w.i circle completed and the market will continue to extend and subdivide as I have labeled the chart.

(As a reminder, I do not trade first waves after a top or bottom as they are dangerous... especially if you are wrong. I use first waves as confirmation that a trend change has occurred. As such I need to see a five wave decline to get bearish. )

A promising open had me looking for confirmation that a top was in place. As the day unfolded several waves began to overlap and when I compare the ES1-057, ES-057 and the $SPX at the 60 minute chart level , I am unable to confirm with certainty that a top is in place.


The clearest wave count I have is on the 30 min. chart of $SPX. Here I've identified the wave structure from the w.iii crest as a completed w.iv. If this wave labeling is correct, we should see a new high tomorrow.


However, I can easily make a case for an alternate count whereas today's price structure was a leading diagonal... w.i circle.


Finally, here is the ES1-057 contract. Again, I've labeled the structure as a completed w.iv and expect a new high.  If w.v of w.(v) = .618 {waves (i-iii)} then the termination point is 132925 which is the same level that I called for on 2/7/11. Also note that the bollinger bands have contracted and that is an indication that tomorrow could exhibit volatile price action. So be alert for a directional trade set up.

As always, I'll let the price action tell me if my labeling is correct or incorrect. A decline below 131175 in  ES1-057 and 131489 in the $SPX would mean that a near term top had been struck.

I hope you found this update informative.

Best of Trading

Monday, February 7, 2011

The Market Pulse


Above is the chart that I left readers with in my weekly video edition of Heard On The Street
Today I expected a rally in the emini S&P futures and that's what we got.. By the end of the day, w.iii had completed and w.iv is underway.


Looking at the daily continuation and the March contracts, the momentum indicators seem to indicate that price may continue lower in the short term... i.e. the momentum indicator for the March contract may be breaking the established trendline signaling a further decline and the momentum indicator for the continuation contract could decline further before reaching trendline support. Both charts are consistent in calling for lower prices. If my view is correct, price should fall to the .382 -.50 retracement level, a common Fibonacci relationship for fourth wave retracements. This interpretation is invalidated if price prints below w.i (130625).

Once w.iv of w.(v) completes, I'll be looking for w.v to terminate between 1326.75 - 1329.25. It will be interesting to see if this marks the end of the rally that began in July 2010 or if the market will push higher to the 1341-1348 areas that I mentioned in my weekly video edition of Heard On The Street

I hope you found this edition of the Market Pulse helpful.

Best of Trading

Sunday, February 6, 2011

Heard On The Street: Three Topping Markets

The US and other world markets continue their advance. While investors believe that they're on a one way street heading north, Elliott wave patterns suggest that a u-turn pivot is near for the S&P, DAX and the FTSE100.


To gain unfair advantage over other traders and a detailed perspective of significant resistance, target areas and wave structures...  view this brief video update.


Best of Trading

Wednesday, February 2, 2011

The Market Pulse

The last time we spoke I left readers with the possibility that w.(2) had ended at 129950 and the appropriate wave labeling as contained here at :

http://elliottwavelive.blogspot.com/2011/01/market-pulse-s-and-crude-oil.html

That's not what transpired as the wave count was blown out after two days of advancing prices. While I was absolutely WRONG, two valuable lessons can be learned.

1. From the labeling in Monday's post I showed a completed five wave decline which had me looking up as the Elliott rules and guidelines state that a five wave structure is followed by a three wave countertrend structure. However, in the case of my incorrect assessment of the market, what I should have been looking for is another five wave advance to new highs (more on this later). My point is... that even though I was wrong on the wave labeling, the minimal expectation was at least a three wave advance.... thus from a directional standpoint I was right.

Here's why:


If a trader acted on the completion of the decline from 129950 to 127050, then the probability of price movement in the desired direction (up) would be likely because only two possibilities existed:

i) That the decline ending at 127050 was a C wave or,
ii) that the decline was wave i.

Bottom line: Both scenarios called for higher prices giving a trader confidence in executing a trade. Traders using the wave principle should always look for a minimum of a three wave structure in the anticipated direction.

2. Waves are fractal in nature, i.e. that smaller wave structures make up larger wave structures. My failure to evaluate the daily higher time frame caused me to prematurely call the top.


Here is the previous daily chart showing that w.(2) had ended. While I can and certainly did make a case for this wave labeling, it was incorrect.

Here is the revised labeling.


Looking at the wave structure from w. iii circle to w.iv circle, the pattern is a three wave decline. That's corrective. Now looking back at the 60 minute chart level that was presented earlier, notice that the decline from 129950 to 127050 was w.c at the daily chart level. Had I looked at the 60 minute fractal and then reviewed the daily chart level, I would have had a better idea that w.(2) wasn't indeed completed.


Let's look at the current advance from 127050. The market has completed w.(iii) and w.(iv) is unfolding. According to the rules and guidelines of EWP, second and fourth waves follow an alternating pattern. Since w.(ii) was sharp, w.(iv) should be a sideways correction. That's whats occurring.

The most common Fibonacci relationship for fourth wave declines is .382 ;therefore, I'll be looking for a completed pattern near 1295 that will be followed by another five wave impulsive move to new highs.

I hope you have found this information helpful.


Best of Trading