Wednesday, October 26, 2011

Market Swings and Deep Retracements

Do recent market swings and deep retracements have you confused? If so, bring clarity to your trading by taking a top down approach rather than focusing on the time frame that you trade.... much like working a puzzle.

Start your analysis, the same way you work a puzzle... that is, look at the picture first !  Looking at quarterly, monthly and weekly charts will allow you to gain insight as to how the lower time frame wave pattern fits into the  "BIG PICTURE". 

Let's look at an example that is possibly unfolding right now in currencies. The markets have been highly correlated to the EUR-USD pair and therefore I'm looking at the Euro for clues to explain the deep retracements and overlapping waves.

Did you miss this contracting triangle?


Triangles are important to an elliotician as they forewarn that an advance, or decline has about run it's course. The pattern, is considered a continuation pattern and occurs prior to the final wave in a wave sequence. As such, triangles can be found in waves B, X or wave 4 positions. At the quarterly chart level, we see a possible triangle occupying the w. B circle position that may be followed by a five wave sequence to complete w.C circle.


Dropping to the monthly chart, we can see the subdivisions of the pattern. Notice that each wave is made up of three wave zig-zag patterns that are common to triangular formations.  That being said, the question that remains is whether the pattern is complete as indicated in the quarterly or requires another up sequence to complete w.(E) as shown in the monthly chart.

Now review your weekly, daily and 240 minute chart levels and you should be able to accurately forecast and anticipate the next move in multiple markets.

I hope you found this trading lesson helpful.

Best of Trading


Sunday, October 23, 2011

Trading Lessons: Accurately Analyzing MACD Divergences

Every Friday I dedicate my day to working in a Trading Lab to either developing new trading ideas or enhancing an existing trading strategy. This weeks trading lesson is based upon two hypothetical trades that I made during Friday's session and focuses on accurately analyzing MACD divergences and how the indicator can be used to confirm your elliott wave analysis.

Numerous professional traders dispel the use of divergence analysis but as you will see, when used to compliment your elliott wave analysis, divergences can help confirm your count and assist in determining market tops and bottoms.

I hope the examples contained within the following video will encourage you to do your own analysis and become confident to act on divergence analysis.


Best of Trading


Wednesday, October 19, 2011

The Market Pulse

Announcements

Most of my readers are aware that I have been working on building a website that is more suitable for educating interested parties. It is apparent through the frequency and engagement of my readership that my content is valued. I thank you for your support. While my newsletters are meant to be educational and illustrate the application of Elliott Wave Theory, I'm aware that the possibility exists where readers may be making certain assumptions and or investment decisions based upon my work even though no advice has been specifically provided.... and therein lies the problem according to my attorney. I need to take precautionary steps  and rethink how I can deliver content while protecting myself from "people just being people" . Therefore, until further notice, I will need to discontinue my newsletter services. I know that many of you look forward to reading my newsletter but I must take these steps. With your understanding and cooperation, I hope to find a temporary solution before launching my new site that gives readers the tools, insight and strategies to achieve trading success using elliott wave.  

In the meantime....


Best of Trading

$ES_F: FLASH ALERT


A quick update of what I've been watching all day. As you know I've been calling for upside potential to 1242-43 (see The Market Pulse for details ). The pattern appears to be unfolding in a w.4 combination, where w.y is a triangle. Patterns of this nature are continuation patterns. Therefore, I continue to look higher in this market.

Expect the remainder of the pattern to unfold as indicated. Each wave of the triangle is a three wave structure. Only a loss of 1217.5o would concern.

Let's see what happens.


Best of Trading

Monday, October 17, 2011

The Market Pulse


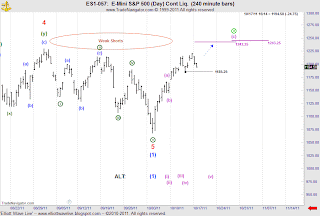
In yesterday's video edition of Heard on the Street, I showed this chart and mentioned that I believed that the market would take out the shorts who had placed their stops just above the minor w.4 crest of 1229.75. The chart is updated through today's trade and to the untrained eye it appears that my analysis was incorrect. 


Yet, sometimes the daily session isn't enough to provide the entire picture. Sometimes we need to watch the globex session and or the Cash to gain insight to what's really happening. Notice from the above chart that the "all sessions"  DID print above the w.4 crest. In fact, it did so on the ES_F 240 min chart level (not shown) within the 8:30 am price bar.

While the minimal requirements have been satisfied to complete w.a circle, there remains the potential for further upside. A loss of 1185.25  (see first chart) would increase the likelihood that w.a circle had completed and that w.b circle is underway. Likewise a print beyond 1221.5 (ES1-057) or 1330.75 (ES_F) would mean that w.a circle was still subdividing and reopen the case for the 1242-43.


At the 5 min chart level, today's decline looks to be in three waves and what I have labeled as w.(c) has a shallower slope than w.(a).... that's corrective! So I won't be surprised to see some type of retracement either in the ON session or in tomorrow's trade. 

Let's leave it there for tonight and see what develops.


Best of Trading 


Wednesday, October 12, 2011

The Market Pulse


Today's price action may constitute a reversal as show here in the CASH, but not as dramatic as in the emini S&P (see below).

There remain several possible counts due to the fact that there have been no discernible retracements from which to accurately draw any high probability conclusions.  While the chart above depicts a w.a termination, I can easily argue that the advance isn't complete. Therefore , it's best to step aside and wait for the market to show us some more pieces of the puzzle.


At the daily chart level of the emini's, today's session formed a bearish shooting star right at structural resistance. The candle implies a reversal as sellers entered the market. I'd like to see follow through and a closing of the gap to bolster the bearish case for a w. b decline.


My reasoning for the above statement is due to the fact that allot of weak shorts have their stops just above the 1214.5 and 1229.75 swing highs and as we all know ... the locals and bots love to hunt stops and inflict pain on the most market participants. Some shorts were flushed today as priced reached an intraday high of 1216. Th fact that I can't offer a high probability count at this juncture has be thinking that the potential for a reversal may be a head fake to the downside that will ultimately reach  a point where w.c = w.a at 1233. Only thereafter will the market lower.

Watch the ON session for clues.

Best of Trading


Chart of the Day: A Telling Trend in PowerShares DBA


The weekly chart of the PowerShares ETF, ticker symbol DBA is showing the continuation of the recent bearish trend. DBA completed cycle w.b at $35.58, followed by a five wave leading diagonal that set the stage for further declines in this ETF. Subsequent price action continues to exhibit impulsive behavior signaling further rounds of selling and the continuation of the bear market for Ag shares.

But first, DBA must complete w.(2). Preliminary targets for the W.(2) advance surround the .50-.618 retracement of w.(1). Thereafter, this ETF should fall on itself and the Bears shouldn't relinquish control until price has fallen below $22.50 w.a.

If you are interested in this ETF, I'll be following DBA throughout the remainder of the year with periodic updates and conclude a summary recap in my year end Global Gains Perspective.


Monday, October 10, 2011

The Market Pulse

ANNOUNCEMENTS

A bit of housekeeping is in order before moving forward with tonight's call.


  • In Sunday's edition of Heard on the Street the following charts of the emini S&P where provided and I need to clarify a point. If you look closely at the charts, you'll notice that w.(1) is located a different price locations on the charts. This is not by accident but a failure on my behalf to properly identify that one is an alternate count of which I will address in tonight's call.


  • In this chart of the Canadian Dollar, I interpreted the structure as a flat correction, primarily due to the fact that w.B circle has retraced near 90% of w.A circle. However, the structure can't be identified as such as w.A is clearly five waves and therefore the correct identification would be that of a zig-zag. (5-3-5). While the retracement level is not ideal,the pattern is valid since the only requirement for a zig-zag is that the B wave can't go beyond the origin of the A wave.


At the daily chart level, impulsive behavior to the downside confirms the count and another round of selling is required to complete w.(1). A print above .998 before making a new low would bring into question that another pattern is developing.


S&P


There are multiple ways to count the advance from 1068 in the ES_F or 1074.77 in the CASH. In the absence of any sizable retracement to hang my hat the daily chart level offers the clearest count.


Here I'm working a five wave advance and looking for a small retracement tomorrow or in the ON session followed by another rally to complete the advance. Notice structural resistance comes into play just above the market.


Yet another possible count is where w.(2) unfolds as a simple zig-zag. I have placed three expansion levels on the chart for your review. Notice how price disrespected the first level of resistance... a sign of strength. Price is approaching the second target and I'll be watching how price reacts to 1202.25, where w.c=w.a. Should a decent retracement not occur, odds are the market will push to the upper target, which by the way fits with the 2007-2011 analogy i.e. a retest of the neckline.

Let's see what happens tomorrow.

Best of Trading

Wednesday, October 5, 2011

The Market Pulse


Here is the 20 min chart that I left readers in last nights FLASH ALERT. As you can see, the market made a .236 retracement of w.(iii) and has advanced just past the upper fib target of 1137.75.


I've updated the wave labels through today's close. Notice that I've added an additional fib level of 1141.5. Given that price nearly tagged this level, the slope of w.(v), diverging momentum (not shown) and weaker internals.... odds are high that this sequence is complete.

For the ON session or in tomorrow's trade, the count suggest that a w.(b) will unfold in three waves. Prints below the w.(iv) low of 1109.5 would provide the initial evidence to call w.(a) complete while prints above 1141.25 would negate.

As a reminder, I'm not sold on the fact that 1068 is the LOW and the price action is sloppy from 1229.75. Needles to say... I'm watching this market very carefully.

Let's leave it there for tonight and ...

Best of Trading

Tuesday, October 4, 2011

ES_F : Flash Alert


Today's trade reached my 1165-66 lower price target, yet the waves don't count well. The above chart is provided in response to a tweet that I made. I said, "Readers who may be utilizing an ending diagonal would be accepting a less than textbook pattern". If you calculate the waves as labeled, each successive three wave decline from the w.4 high is greater than the prior. Therefore, I would assign a very low probability to it from an academic level.

While I have not had an opportunity to review all the intraday charts at this juncture I wanted to share what I have discovered and what I'm looking for tomorrow.

The next series of charts show momentum signatures. Each is self explanitory and implies that the "risk" is now to the downside... meaning the likelyhood for significant further declines are greatly reduced.


Also, note that price tagged 3-Sigma that contains 99.9% of all price movement and has bounced.


Heavy volume came into the market around 3:30 EST, in what I am labeling w.(iii). For the ON session prices should drift lower to either the .236-.382 retracement of w.(iii), followed by another advance to where w.(v) = w.(i). Note that I am not calling a bottom yet. I'm only evaluating the wave structure from today's low. More evidence is required to conclude that the selling that began from1357.25 had ended and that a tradeable low is in place.

Whether the initial five wave advance completes in the ON session remains to be seen.

Let's see what unfolds.

Monday, October 3, 2011

The Market Pulse

A Bearish Continuation


Today was really exciting if you were following along with the call from Heard on the Street. Of the markets I featured, Crude (2.50), Copper (7.60), Euro (.02) Nasdaq futures (70), Emini S&P (40).


What we learned today

  • The Euro and the emini S&P remain tightly correlated.
  • NQ-057 confirmed that w.2 had ended on 9/20/11
  • ES-057 eliminated two bullish alternate counts.


Nasdaq


Today the Nasdaq futures gapped down at the open confirming what I believe is 3rd wave price action. The break of w.x low confirmed that the high made on 9/20 is complete and that new lows should follow over the next few days.

Although there are several ways to count the decline from 2285.25 (w.(ii) crest ), I'm looking down in this market. My initial w.(iii) target remains at 1981. Technical studies do not suggest a w.(iv) bounce. However, should one develop, price should stay below 2144.5.


Emini S&P


This chart was featured in Heard on the Street  as alternate counts where w.4 or w.(2) would
unfold as a flat correction. Both these interpretations were eliminated today due to the fact that price made a new low.


So that leaves us with two counts. An expanded flat with w.B targeting 1146 -1165 as in the above weekly chart and...


where w.5 is unfolding. The minimum expectations have been met to conclude that a five wave decline now exists from 1357.25. I haven't defined clear targets as the count still needs to prove itself by continuing to act implusively and extending further to the downside. A rotation back above 1106.75 would concern. There are several fibs that may provide support but a fib cluster surrounding 1165-66 provides the highest probability zone to look for a reversal.

Now that five waves can be counted, the implications are very bearish as a three wave relief rally {w.(2)} should follow that once complete will be followed by an even larger five wave decline w.(3) that draws price significantly lower than current levels.


Let's see what develops overnight and watch the Euro for further tells about the ES_F short term direction.


Best of Trading

Sunday, October 2, 2011

Heard on the Street: S&P, Nasdaq, Crude Oil, Copper

In this weeks edition of Heard on the Street I'll cover the emini S&P, Nasdaq, crude oil, and copper.


Best of Trading