Today's trade reached my 1165-66 lower price target, yet the waves don't count well. The above chart is provided in response to a tweet that I made. I said, "Readers who may be utilizing an ending diagonal would be accepting a less than textbook pattern". If you calculate the waves as labeled, each successive three wave decline from the w.4 high is greater than the prior. Therefore, I would assign a very low probability to it from an academic level.
While I have not had an opportunity to review all the intraday charts at this juncture I wanted to share what I have discovered and what I'm looking for tomorrow.
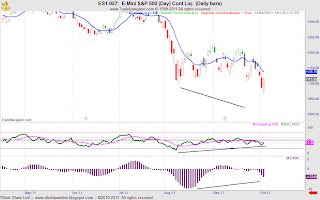
The next series of charts show momentum signatures. Each is self explanitory and implies that the "risk" is now to the downside... meaning the likelyhood for significant further declines are greatly reduced.
Also, note that price tagged 3-Sigma that contains 99.9% of all price movement and has bounced.
Heavy volume came into the market around 3:30 EST, in what I am labeling w.(iii). For the ON session prices should drift lower to either the .236-.382 retracement of w.(iii), followed by another advance to where w.(v) = w.(i). Note that I am not calling a bottom yet. I'm only evaluating the wave structure from today's low. More evidence is required to conclude that the selling that began from1357.25 had ended and that a tradeable low is in place.
Whether the initial five wave advance completes in the ON session remains to be seen.
Let's see what unfolds.


No comments:
Post a Comment