Thursday, June 28, 2012

Distinguishing Wave Personality: ObamaCare, US Economic and Eurozone Crisis


Today is an important day for world markets. While European regulators and PM's struggles to save Europe, here in the US, the Supreme Court rules on the constitutionality of ObamaCare. 

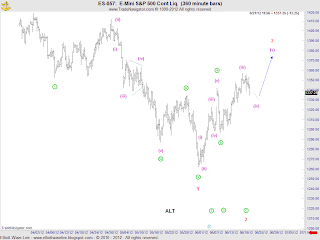
I personally will not be trading today. It's gambling and too risky. However, the chart above is just a possible scenario that I am watching today. Note that the opening print is 10am. I sometimes use this chart configuration to remove noise from the ON session and open. 

As you can see, this is somewhat of a different count from my last update where I was looking for a 4th wave. That 4th wave count still remains viable (see chart below)  BUT I'm showing this chart because often, the personality of waves can somewhat help you confirm your wave count. With two counts pointing down, the only way to confirm which count is correct is to look at the personality of the next decline. From the top chart, ff the most recent advance to 1328.5 was indeed w.ii circle, then we should see a swift and massive decline over the next few days that easily exceeds my target of 1295.75 (see chart below). 


I hope you found this post helpful and ...


Best of Trading


Tuesday, June 26, 2012

Natural Gas Futures vs $UNG


In response to an earlier tweet where I said " $UNG doesn't correlate well bc of how contract rolls. Look at these but their charts are mess $APC $DVN $EOG $SWN $RRC" 


Correlation was a poor choice of words and mislead some readers. What I meant or should have said is that Contango (higher prices for longer-dated futures contracts) destroys UNG value as it rolls from a lower-priced maturing contract into the next longer-term higher priced contract. Thus returns are not correlated. 


Best of Trading 


======================================================================
ElliottwaveLive is not an investment advisory service or broker dealer. None of its contributors are registered investment advisors, licensed stock brokers or CTA's. The author may hold short term and long term positions in the futures, stocks and ETF's discussed herein. The author may also trade around those positions which may be in direct conflict with your positions. Complete trade disclosures of the contributor’s holdings are posted at www.elliottwavelive.blogspot.com. See Trader Disclosure. 


Trade at your own risk. The blog site, Newsletter and all other information, material and content accessible from this Site (collectively, the "Content")  provided herein provides the context for market analysis with respect to a market's, a security or a commodity's general position utilizing the Elliott Wave Principle. The Content contained herein are the opinion and general comments of the author and is based upon information that Mr. Sinibaldi considers reliable but neither ElliottWaveLive nor he warrants it's completeness or accuracy and it should not be relied upon as such. Mr. Sinibaldi or ElliottWaveLive (collectively, referred to as “EWL”) are not under any obligation to update or correct any content provided on this website. Any statements and or opinions are subject to change without notice. The content and comments contained herein neither purports nor intends to be, specific trading advice. It has been prepared without regard to any particular person's investment objectives, financial situation and particular needs. Information should not be considered as an offer or enticement to buy, sell or trade. 


A more and comprehensive Risk Disclaimer and Disclosure Statements is available within the left margin of this blog site.  

COT Data for ES : Net Short?


Who Is Net Short?


Self explanatory chart. Only Commercials are currently net short. Notice the bullish positions in 10/2008-3/2009 by Large and Small Specs. 

Today we find the Small Spec remains bullish and we all know what that means!


Best of Trading 

======================================================================
ElliottwaveLive is not an investment advisory service or broker dealer. None of its contributors are registered investment advisors, licensed stock brokers or CTA's. The author may hold short term and long term positions in the futures, stocks and ETF's discussed herein. The author may also trade around those positions which may be in direct conflict with your positions. Complete trade disclosures of the contributor’s holdings are posted at www.elliottwavelive.blogspot.com. See Trader Disclosure. 


Trade at your own risk. The blog site, Newsletter and all other information, material and content accessible from this Site (collectively, the "Content")  provided herein provides the context for market analysis with respect to a market's, a security or a commodity's general position utilizing the Elliott Wave Principle. The Content contained herein are the opinion and general comments of the author and is based upon information that Mr. Sinibaldi considers reliable but neither ElliottWaveLive nor he warrants it's completeness or accuracy and it should not be relied upon as such. Mr. Sinibaldi or ElliottWaveLive (collectively, referred to as “EWL”) are not under any obligation to update or correct any content provided on this website. Any statements and or opinions are subject to change without notice. The content and comments contained herein neither purports nor intends to be, specific trading advice. It has been prepared without regard to any particular person's investment objectives, financial situation and particular needs. Information should not be considered as an offer or enticement to buy, sell or trade. 


A more and comprehensive Risk Disclaimer and Disclosure Statements is available within the left margin of this blog site.   


ES Update for June 25 - 26


Yesterdays big down at the open shouldn't have surprised elliott wave practitioners.  We were following the final subdivisions of an A-B-C correction that once complete, would lead to another round of selling. For a more detailed review of Friday's post  click here.  


Above is the all session , 15 min chart as opposed to the daily session chart above. Fast moving impulse waves can be initially difficult to label  UNLESS we know which wave is the extended wave.  I've now added some wave labels to describe the decline from the 6/19/2012 high which represent my preferred wave count. While it remains to be seen as to whether w.(iv) is already complete or develops in a more complex fashion, I'm looking for another wave down to complete this five wave sequence once w.(iv) is confirmed complete. 

Best of Trading

======================================================================
ElliottwaveLive is not an investment advisory service or broker dealer. None of its contributors are registered investment advisors, licensed stock brokers or CTA's. The author may hold short term and long term positions in the futures, stocks and ETF's discussed herein. The author may also trade around those positions which may be in direct conflict with your positions. Complete trade disclosures of the contributor’s holdings are posted at www.elliottwavelive.blogspot.com. See Trader Disclosure. 


Trade at your own risk. The blog site, Newsletter and all other information, material and content accessible from this Site (collectively, the "Content")  provided herein provides the context for market analysis with respect to a market's, a security or a commodity's general position utilizing the Elliott Wave Principle. The Content contained herein are the opinion and general comments of the author and is based upon information that Mr. Sinibaldi considers reliable but neither ElliottWaveLive nor he warrants it's completeness or accuracy and it should not be relied upon as such. Mr. Sinibaldi or ElliottWaveLive (collectively, referred to as “EWL”) are not under any obligation to update or correct any content provided on this website. Any statements and or opinions are subject to change without notice. The content and comments contained herein neither purports nor intends to be, specific trading advice. It has been prepared without regard to any particular person's investment objectives, financial situation and particular needs. Information should not be considered as an offer or enticement to buy, sell or trade. 


A more and comprehensive Risk Disclaimer and Disclosure Statements is available within the left margin of this blog site.  


Monday, June 25, 2012

Is It Really Time To Be Bullish Natural Gas?

Recently there has been allot of chatter and interest in Natural Gas. I've created a training video to help you identify trading and investment opportunities using elliott wave and while where at it determine the direction of this energy commodity.

Enjoy


http://youtu.be/2VwwIbWS1nY


======================================================================
ElliottwaveLive is not an investment advisory service or broker dealer. None of its contributors are registered investment advisors, licensed stock brokers or CTA's. The author may hold short term and long term positions in the futures, stocks and ETF's discussed herein. The author may also trade around those positions which may be in direct conflict with your positions. Complete trade disclosures of the contributor’s holdings are posted at www.elliottwavelive.blogspot.com. See Trader Disclosure. 


Trade at your own risk. The blog site, Newsletter and all other information, material and content accessible from this Site (collectively, the "Content")  provided herein provides the context for market analysis with respect to a market's, a security or a commodity's general position utilizing the Elliott Wave Principle. The Content contained herein are the opinion and general comments of the author and is based upon information that Mr. Sinibaldi considers reliable but neither ElliottWaveLive nor he warrants it's completeness or accuracy and it should not be relied upon as such. Mr. Sinibaldi or ElliottWaveLive (collectively, referred to as “EWL”) are not under any obligation to update or correct any content provided on this website. Any statements and or opinions are subject to change without notice. The content and comments contained herein neither purports nor intends to be, specific trading advice. It has been prepared without regard to any particular person's investment objectives, financial situation and particular needs. Information should not be considered as an offer or enticement to buy, sell or trade. 


A more and comprehensive Risk Disclaimer and Disclosure Statements is available within the left margin of this blog site.  

Sunday, June 24, 2012

Chinese Data Mask Depth of Slowdown? An Investigative Look

The following article http://nyti.ms/MsM5gb  appeared in the New York Times on June 22,2012. It described the possibility that Chinese economic data could be masking the depth of deepening slowdown. 


While all the academics and investment banks continue their debate, I thought I'd take an investigative look at the Shanghai Composite, Crude Oil, Copper and Coal.

I'd like to provide my analysis in an attempt to illustrate the value of the Elliott Wave Principle. Please form your own conclusions about the potential direction of each market. 


Shanghai Composite


I've been working this count for the Shanghai Composite since August 2011. To date nothing has changed as I'm anticipating the market will test 2028.  

Copper


Crude Oil


Coal


Best of Trading

======================================================================
ElliottwaveLive is not an investment advisory service or broker dealer. None of its contributors are registered investment advisors, licensed stock brokers or CTA's. The author may hold short term and long term positions in the futures, stocks and ETF's discussed herein. The author may also trade around those positions which may be in direct conflict with your positions. Complete trade disclosures of the contributor’s holdings are posted at www.elliottwavelive.blogspot.com. See Trader Disclosure. 


Trade at your own risk. The blog site, Newsletter and all other information, material and content accessible from this Site (collectively, the "Content")  provided herein provides the context for market analysis with respect to a market's, a security or a commodity's general position utilizing the Elliott Wave Principle. The Content contained herein are the opinion and general comments of the author and is based upon information that Mr. Sinibaldi considers reliable but neither ElliottWaveLive nor he warrants it's completeness or accuracy and it should not be relied upon as such. Mr. Sinibaldi or ElliottWaveLive (collectively, referred to as “EWL”) are not under any obligation to update or correct any content provided on this website. Any statements and or opinions are subject to change without notice. The content and comments contained herein neither purports nor intends to be, specific trading advice. It has been prepared without regard to any particular person's investment objectives, financial situation and particular needs. Information should not be considered as an offer or enticement to buy, sell or trade. 


A more and comprehensive Risk Disclaimer and Disclosure Statements is available within the left margin of this blog site.  


Friday, June 22, 2012

ES Update

The market has followed my initial trade plan  for today and continues to push to higher levels. Technicals (not shown) do not support a completed corrective pattern, so I'm looking higher under the following two scenarios. Some key levels, I'm watching are provided for reference only!


Best of Trading

======================================================================
ElliottwaveLive is not an investment advisory service or broker dealer. None of its contributors are registered investment advisors, licensed stock brokers or CTA's. The author may hold short term and long term positions in the futures, stocks and ETF's discussed herein. The author may also trade around those positions which may be in direct conflict with your positions. Complete trade disclosures of the contributor’s holdings are posted at www.elliottwavelive.blogspot.com. See Trader Disclosure. 


Trade at your own risk. The blog site, Newsletter and all other information, material and content accessible from this Site (collectively, the "Content")  provided herein provides the context for market analysis with respect to a market's, a security or a commodity's general position utilizing the Elliott Wave Principle. The Content contained herein are the opinion and general comments of the author and is based upon information that Mr. Sinibaldi considers reliable but neither ElliottWaveLive nor he warrants it's completeness or accuracy and it should not be relied upon as such. Mr. Sinibaldi or ElliottWaveLive (collectively, referred to as “EWL”) are not under any obligation to update or correct any content provided on this website. Any statements and or opinions are subject to change without notice. The content and comments contained herein neither purports nor intends to be, specific trading advice. It has been prepared without regard to any particular person's investment objectives, financial situation and particular needs. Information should not be considered as an offer or enticement to buy, sell or trade. 


A more and comprehensive Risk Disclaimer and Disclosure Statements is available within the left margin of this blog site. 


ES Count


Yesterdays unorthodox top, or what may be the top of w.2 has lead to an impulsive decline that appears to be incomplete. The chart depicts my initial count of the decline, however, the topping price action has me leery and suggests that I be cautious early on and let the market prove itself before I commit to it. 


Let's see what develops. 


Best of Trading


======================================================================
ElliottwaveLive is not an investment advisory service or broker dealer. None of its contributors are registered investment advisors, licensed stock brokers or CTA's. The author may hold short term and long term positions in the futures, stocks and ETF's discussed herein. The author may also trade around those positions which may be in direct conflict with your positions. Complete trade disclosures of the contributor’s holdings are posted at www.elliottwavelive.blogspot.com. See Trader Disclosure. 


Trade at your own risk. The blog site, Newsletter and all other information, material and content accessible from this Site (collectively, the "Content")  provided herein provides the context for market analysis with respect to a market's, a security or a commodity's general position utilizing the Elliott Wave Principle. The Content contained herein are the opinion and general comments of the author and is based upon information that Mr. Sinibaldi considers reliable but neither ElliottWaveLive nor he warrants it's completeness or accuracy and it should not be relied upon as such. Mr. Sinibaldi or ElliottWaveLive (collectively, referred to as “EWL”) are not under any obligation to update or correct any content provided on this website. Any statements and or opinions are subject to change without notice. The content and comments contained herein neither purports nor intends to be, specific trading advice. It has been prepared without regard to any particular person's investment objectives, financial situation and particular needs. Information should not be considered as an offer or enticement to buy, sell or trade. 


A more and comprehensive Risk Disclaimer and Disclosure Statements is available within the left margin of this blog site. 

Thursday, June 21, 2012

ES-057 Update


Earlier in the morning session we had a bunch of bad economic news. I warned, that in my opinion we shouldn't be quick to call an end to the counter trend rally ad that my line in the sand was 1338.75.

Indeed that level has been broken and for now the rally's advance has been halted. However, as you can see from my interpretation of the market's position, I can't rule out the possibility that a w.(iv) is still unfolding in hopes to trap early shorts, then blow them out in one last advance to complete w.2. That's how I'm playing it. 


Also note the possibility under my alternate count that w.2 could be complete in what would be a w.v truncation.

Best of Trading

======================================================================
ElliottwaveLive is not an investment advisory service or broker dealer. None of its contributors are registered investment advisors, licensed stock brokers or CTA's. The author may hold short term and long term positions in the futures, stocks and ETF's discussed herein. The author may also trade around those positions which may be in direct conflict with your positions. Complete trade disclosures of the contributor’s holdings are posted at www.elliottwavelive.blogspot.com. See Trader Disclosure. 


Trade at your own risk. The blog site, Newsletter and all other information, material and content accessible from this Site (collectively, the "Content")  provided herein provides the context for market analysis with respect to a market's, a security or a commodity's general position utilizing the Elliott Wave Principle. The Content contained herein are the opinion and general comments of the author and is based upon information that Mr. Sinibaldi considers reliable but neither ElliottWaveLive nor he warrants it's completeness or accuracy and it should not be relied upon as such. Mr. Sinibaldi or ElliottWaveLive (collectively, referred to as “EWL”) are not under any obligation to update or correct any content provided on this website. Any statements and or opinions are subject to change without notice. The content and comments contained herein neither purports nor intends to be, specific trading advice. It has been prepared without regard to any particular person's investment objectives, financial situation and particular needs. Information should not be considered as an offer or enticement to buy, sell or trade. 


A more and comprehensive Risk Disclaimer and Disclosure Statements is available within the left margin of this blog site.


Thursday, June 7, 2012

A Quiz That Gives A Hint For The Market

 The Key For Equity Market Movements


In just 5 seconds, tell me whether the wave pattern from the top is impulsive or a correction. Then try labeling the pattern. 

Additional comments will be provided once everyone has had an opportunity to respond or take mental notes.

Best of Trading

S&P Trade Plan For 6/7/2012

Egg On My Face But That's Alright


We've all been there before and we'll be there again. The place I'm referring to  is a time when hours of  technical analysis lay the foundation  for trade set ups, only to have the market make you look silly. Well that's what happened yesterday. 


Above is the chart that I used as my template for market action. At the time of yesterdays post, a nice decline began from resistance. A positive sign, yet my TP called for confirmation in five waves down before acting. 

Here's an excerpt the original text from 6/6/2012 where I said,

"This count is part of my trade plan and is only a possible attempt to describe the markets position in real time. w.(c) = 1.618 w.(a), where w.(b) is a running flat. The overall interpretation is still subject to confirmation of five waves down before the possibility of making any trading decisions. Obviously breaks above 1300.75 negate." 

Click  here to view the full text of yesterdays Trade Plan.


As the price shortly reversed and broke 1300.75 the opportunity for a short trade was gone. The massive rally that occurred throughout the day, is FED induced. More manipulation. Hope and Prayer! While this left egg on my face, my account incurred  ZERO damage. That's why we have trade plans and trade what I see not what I think. 


Here's my updated daily chart showing a completed five down. If I'm correct, price will rally in three waves then fall in five waves below 1262 low. At a minimum, the trade plan calls for a 5-3-5 move to the downside and that's if the move from 3/27/2012 top (1419.75) turns out to be corrective rather than a new trend down. 


Dropping down to a 360 intraday chart, the move from w.1 low appears to be incomplete. As I view this chart, I see a small triangular shaped price pattern (found in 4th and b waves only and prior to a terminal move ). A thrust up should follow , which it has. 

The minimal requirements have been met to complete the pattern  as price exceeded 1314. However, my upside targets that I'm looking to possibly trade are where w.(v) = w.(i) at 1328.5 and where w.(v)= .618 {w.(i) - (iii)} at 1342.75. Also note that the previous 4th of one lesser degree ( 1334.25) is roughly the target for a measured move of w.a circle or the entire corrective move (w.2), which I think is a lower percentage play.

Laughingly, let's see if I have a better day.

Best of Trading


======================================================================
ElliottwaveLive is not an investment advisory service or broker dealer. None of its contributors are registered investment advisors, licensed stock brokers or CTA's. The author may hold short term and long term positions in the futures, stocks and ETF's discussed herein. The author may also trade around those positions which may be in direct conflict with your positions. Complete trade disclosures of the contributor’s holdings are posted at www.elliottwavelive.blogspot.com. See Trader Disclosure. 


Trade at your own risk. The blog site, Newsletter and all other information, material and content accessible from this Site (collectively, the "Content")  provided herein provides the context for market analysis with respect to a market's, a security or a commodity's general position utilizing the Elliott Wave Principle. The Content contained herein are the opinion and general comments of the author and is based upon information that Mr. Sinibaldi considers reliable but neither ElliottWaveLive nor he warrants it's completeness or accuracy and it should not be relied upon as such. Mr. Sinibaldi or ElliottWaveLive (collectively, referred to as “EWL”) are not under any obligation to update or correct any content provided on this website. Any statements and or opinions are subject to change without notice. The content and comments contained herein neither purports nor intends to be, specific trading advice. It has been prepared without regard to any particular person's investment objectives, financial situation and particular needs. Information should not be considered as an offer or enticement to buy, sell or trade. 


A more and comprehensive Risk Disclaimer and Disclosure Statements is available within the left margin of this blog site.


Wednesday, June 6, 2012

S&P Updated Trade Plan

As most of my followers know, I like to keep things real... meaning I don't BS anyone and try to provide educational material in real time. As such, here is the chart that I left readers with last night. It includes most recent price action as well as my original trade plan that was discussed last evening.


As you can see, the thin ON session pushed price to the higher 2.0 RF resistance levels cited in this chart.  That's gone beyond a reasonable price level for what I would call a throw over in an ending diagonal pattern. However, that may not mean that my trade plan changes. here's why.

1. 1297.77 is also a Gann 90 degree resistance level that is in agreement with cited fibs.
2. The trade plan called for an actionable plan should price reach my levels in the ON session.


That plan called for confirming a turn in five waves!


Above is an updated chart through 9:09 a.m. est. detailing my updated wave count. This count is part of my trade plan and is only a possible attempt to describe the markets position in real time. w.(c) = 1.618 w.(a), where w.(b) is a running flat. The overall interpretation is still subject to confirmation of five waves down before the possibility of making any trading decisions. Obviously breaks above 1300.75 negate. 

Let's see how the day goes.

Best of Trading

=======================================================================
ElliottwaveLive is not an investment advisory service or broker dealer. None of its contributors are registered investment advisors, licensed stock brokers or CTA's. The author may hold short term and long term positions in the futures, stocks and ETF's discussed herein. The author may also trade around those positions which may be in direct conflict with your positions. Complete trade disclosures of the contributor’s holdings are posted at www.elliottwavelive.blogspot.com. See Trader Disclosure. 


Trade at your own risk. The blog site, Newsletter and all other information, material and content accessible from this Site (collectively, the "Content")  provided herein provides the context for market analysis with respect to a market's, a security or a commodity's general position utilizing the Elliott Wave Principle. The Content contained herein are the opinion and general comments of the author and is based upon information that Mr. Sinibaldi considers reliable but neither ElliottWaveLive nor he warrants it's completeness or accuracy and it should not be relied upon as such. Mr. Sinibaldi or ElliottWaveLive (collectively, referred to as “EWL”) are not under any obligation to update or correct any content provided on this website. Any statements and or opinions are subject to change without notice. The content and comments contained herein neither purports nor intends to be, specific trading advice. It has been prepared without regard to any particular person's investment objectives, financial situation and particular needs. Information should not be considered as an offer or enticement to buy, sell or trade. 


A more and comprehensive Risk Disclaimer and Disclosure Statements is available within the left margin of this blog site.


Tuesday, June 5, 2012

My S&P Trade Plan

The market spent much of the remaining hour using up allot of buying power to achieve a measly 2.5 gain at the 15 minute chart level (not shown). I could easily make a case that I have 5 waves up and done at the close. This, along with harmonic corrective moves (see chart below) and waning momentum (not shown) has me on alert for a reversal. However as you will see in my trade plan for tomorrow, being cautious is prudent. 


THE TRADE PLAN


Above is my preferred count. If correct, I'm looking for another down up sequence to complete the ending diagonal pattern. There is massive resistance between 1289-91as well as the following reverse fib levels as measured from w.(b) to w.(a) [see chart below].


Above is another 60 min. chart of the emini that shows the opening print as of 10:00 est. I often find that the first 1 1/2 hours of trade ends with a smooth transitions to the previous close. I've placed the same resistance levels on the chart but if you look closely 1289.75 is my w.iii low. So this provides structural resistance as well. 

So the stage is set. If the market obliges, then I'm looking to go short. Should the market complete the pattern in the ON session or if a top is already in as stated above, then I'm looking to short against the highs as long as I can count a five wave decline.

Let's see what happens.

Best of Trading


Monday, June 4, 2012

Gold Update - playing wave v up

In my post from earlier today I anticipated a 4th wave correction that when complete would make a recovery high.


Here is the updated chart with a hypothetical trade made for educational purposes. You can see that I'm long from 1616.1, targeting 1647 for an exit. Pulling my stops to break even at this point for a risk free trade.

Best of Trading


Is Gold Still a Safe Haven?


IMO...  Gold futures are targeting 1647. Currently w.iv of w.c  corrective move that will be fully retraced.

Best of Trading

Sunday, June 3, 2012

You Decide The Fate of the Markets

Richard Russell stated in his newsletter, “I believe that the bear signal is telling us that Greece will default, to be followed by Spain, and the whole Eurozone may then fall apart.I consider the April-May action to be a continuation of a primary bear market that started on October 9, 2007, with the Dow at 14,164.53.  We are now dealing with the latter part of the primary bear market that began in 2007.”

While I don't subscribe to the newsletter, I did find myself in agreement with the quote. Everybody that follows me knows that I'm a long term bear and my view hasn't changed. It's lonely taking a contrarian view, especially with thinly traded markets and the manipulation of markets by the FED. Does it concern me that the FED may never stop printing and my shorts may get blown out? Certainly, but surely most readers would agree that the results of massive stimulus around the world hasn't really solved most macro problems. While QE1 and QE2 and Operation Twist has been supportive to US markets... each  has failed to push the broader market to new highs. Europe is in full crisis mode that threatens to take down global markets like dominos. China exports the majority of their goods to Europe. Australia is highly dependent on China for material purchase. Pundits say the  US is isolated from the Euro contagion. I ask how, since industrial multinational earnings will surely miss.
I wanted to briefly share what I'm looking at. Just charts... not allot of detailed commentary..... for you to evaluate. Enjoy

DOW


Dow upper resistance trendline holding yet I'm watching for the possibility that the same fractal pattern as shown in the shaded box may play out leading to another major advance. 


CRB Index


Working cycle w. III with much further downside risk. If equities experience a similar fate as last summer, commodities should continue their decline (See US Dollar, all in one chart.)


US Dollar


The Dollar has been building a base that supports the overall decline of commodities.


S&P vs CRB (All In One)


Notice commodities declined after each equity peak. However, as the the wave count of the CRB chart (above) indicates, a major top is in and explains why commodities continue their decline while equities were able to make a modest recovery highs.


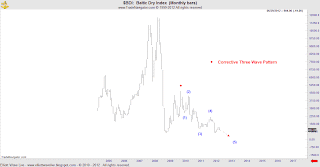
Baltic Dry Index


VIX


The VIX is making a rounded bottom and I expect allot of volatility as price works up the lower right side of the arc. The H&S pattern is only the beginning. This view would be consistent with a more serious decline in equities. 


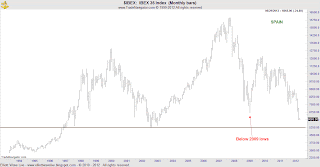
EUROPE


Friday, June 1, 2012

Coal is Dead Money : CLF, ANR, BTU

Coal has been dead money due to many factors such as low natural gas prices and lack of support from the Obama administration.


Big picture chart at the monthly chart level for some coal names. Each are working cycle w.c down.  There are some internal differences in the subdivisions. I've only detailed CLF as the overall interpretation has long been  bearish for the sector. Price broke support today and my expectation is for further weakness in this issue.


Best of Trading