Tuesday, May 31, 2011

Chart of the Day: #Gold $XK-F #Commodities

A Correction or Rally to New Highs ?


At the daily chart level, mini Gold has declined in five waves to w. i circle. The highlighted region shows what I believe is a corrective structure that will lead to another round of selling that should draw prices to below 1462.4.


But how do we know that the rally from 1462.4 is corrective? Looking at the 240 min chart level, we can see the wave structure for the move off the low. Notice that the slope of wave. a circle is greater than w.c. That's what we want to see in a corrective move. If the move was impulsive, then the last swing to 1540.8 would have a greater slope than wave a circle. Secondly, price has remained within a corrective price channel. Only a decisive break above the upper boundary of the channel would imply third wave price action. Also note that w.b circle retraced approx 80 % of w. a circle implying that a flat correction is unfolding. In addition, w.c circle of w.ii circle = w.a circle at 1538.8 and the only other fib extension is where w.c circle = 1.618 w.a circle at 1580.30 (THAT'S A NEW HIGH) and is unlikely unless I dead wrong. Prices could inch higher in today's trade to 1543.1 where w. c circle = 1.236 RF of w.b circle. A close below 1515.10 would confirm that w. ii circle had completed and that w. iii circle down was underway. 

Finally note the alternate count that would imply that a new high would eventually be reached. At the present time the odds are that the high is in but frankly, either interpretation draws prices lower so a short opportunity exists either way.

I hope you found this information helpful and best of trading.


Heard On The Street

ANNOUNCEMENTS:

Moving forward, the weekly edition of Heard on the Street will focus on the monthly, weekly and daily perspectives, while my M-W-F edition of The Market Pulse will focus on the daily, 240 minute and lower time frame perspectives. In doing so, the weekly recap will cover more markets and detailed discussion regarding the larger trend in each market.

IS THE RISK TRADE STILL ON?

The last high that the market made was almost one month ago and up until Wednesday of last week, the market had lost 71.25 points. The wave pattern remains open for interpretation but favors a sideways to down bias. Learn what to expect by watching this weeks video edition of Heard On the Street where I'll cover the Emini S&P, Copper and the EUR-USD.


Friday, May 27, 2011

Chart of the Day: $DX_F #USD


The USD appears to be working an expanded flat correction for w.ii circle. A the time of this post, price has reached a strong level of support... so look for a bounce.


However, common fib ratios call for further decline where w.c circle of w.ii circle = 1.618 w.a circle at 74.185 which agrees with the .618 retracement of w.i circle at 74.13. Also note that additional fib support exists at 74.265 which is the .618 retracement of the move from 72.86 - 76.54.

On additional fib relationship that I identified is near the .5 retracement of w.i circle. That level is where w.c circle = .618 w.a circle past w.a circle or 74.4.

In conclusion, the area surrounding 74.13 - 74.4 offers a logical termination point of w.ii circle and offers traders an area of consideration as w.iii circle advances to the upside. Any significant decline below 74.13 would warn that the a larger decline may be unfolding and that the expanded flat interpretation was incorrect.

Best of Trading

Wednesday, May 25, 2011

The Market Pulse

Announcement:

I neglected to inform readers in Monday's post that the ending diagonal interpretation was eliminated due to the fact that to many rules and guidelines were violated as the pattern progressed.


Tonight's post will be short as much of the larger wave pattern remains unresolved. Sticking with the near term wave structure, we have six completed waves if w.(b) ? has ended. That leaves one more decline to complete a double zig-zag that began at 1367.25. My target for the termination of the structure remains where w.z = w.w at 1294.25. Only a loss of 1324.5 would cause concern.

Best of Trading


Chart of The Day: Goldman Sacs $GS... Time and Price Equality

The Elliott Wave Principle is a necessity for traders and investors because it's a powerful forecasting method that, when applied correctly, can  identify trade set ups in advance..... sometimes  weeks, months, even years in advance. An example is the January 21 2011 analogy for Goldman Sacs that forewarned investors of the eminent decline.


Fast forward to today and the pattern is unfolding as forecast. Should the analogy be spot on, a time and price relationship exits ... one of equality where w.(Y) = w.(W) at 37 weeks and a bottom should occur during the week of 10/7/2011 +/- 1 week. From a price perspective, w.(Y) = w.(W) at 111.24.

Although a potential trade set up is months away, I'll continue to monitor this security and make periodic updates.  I hope you found this information helpful and ...


Best of Trading

Tuesday, May 24, 2011

Updates on Sugar: $SG_F


The trend in Sugar remains to the downside. The current sideways consolidation in Sugar Futures has been contained within parallel lines, adhering to corrective price action. W.4 red may have ended but the lower boundary of the corrective price channel would need to be broken to confirm that the downtrend had resumed. If the count is correct, look for 17.37-17.72 to end w.(3).

Best of Trading


Chart of The Day: $EUR-USD

Today's chart of the day is the $EURO_USD. As many of you know, the broader analogy that I have been using to guide me is that markets are moving as one. Simply put, trading opposite the direction of the USD with regards to equities and commodities or in the same direction with the $EURO_USD pair.


At the daily chart level, the pair is working what I believe is w.iii cicle. At a minimum, w.iii should obtain equality at 1.3453 but the most common fibonacci relationship exists at 1.2902.


Here is the same chart indicating that support below the market is between 1.3653- 1.3769.


At the intraday chart level, w.iv of w.(i) has competed near the .50 retracement of w.iii and my expectation for today is for a final push down where w.v= .618 {w.(i-iii)} at 1.3794 which is in agreement with the support levels noted at the daily chart level.

I hope you found this information helpful and best of trading.


Monday, May 23, 2011

The Market Pulse


Today's session was highlighted by the index gapping lower at today's open. Much of the heavy selling was done, as usual, in the ON session, so the market could be manipulated by the few and U.S. participants could only sit on their hands for the session.... that is unless you were placing bullish bets.

Back on May 2, 2011, I spoke of two possible alternative counts that are still working behind the scenes. They are an:

a.  expanded flat
b. a running triangle

You can read more about these interpretations by clicking here then fast forward to today's charts and you'll see that these alternatives can't be ruled out at this time. I won't mention them on a daily basis until "price" confirms that either alternative is actually or had formed. What's important to take away from either of these patterns is that BOTH eventually lead to a new high.


In yesterday's edition of "Heard On The Street", I left readers with the above chart and  said, "that the decline from 1367.25 has been contained within a corrective price channel; is choppy and that four waves have been completed within it. I'm looking for w.(a) of w.z to terminate near 1318.25- 1317.75 for tomorrow's trade that will be followed by w.(b) up and a final round of selling to where w.z = w.w at 1294.25. Note nearby structural support of 1290.25 and the .618 retracement of 1290.50 are nearby."

We certainly got the decline, albeit a bit lower than I expected. Earlier today, I alerted Twitter followers that anyone who is running bullish counts should be concerned. Here's why.

1. Notice that RSI broke the key level of 40 indicating that the uptrend may have ended and that a change in trend is underway.  

2. Gaps are not typically found in first or w.a positions. They're usually found in w.3 that would imply heavy selling is on the horizon.

3. The weekly 2-4 trendline is now being challenged (see weekly chart above) for the first time and a break on a closing basis would be mean that a significant top had been made at 1367.25, even though I do not have a satisfactory way of labeling the structure and that a more bearish posture should be adopted.

For the ON session, expect a small countertrend move that targets 1321.25 or 1326.75. Look for an updated chart tomorrow morning.

Best of Trading


Sunday, May 22, 2011

Heard On The Street

Announcement:

This weeks edition of Heard On The Street will not include a video as I had to travel over the weekend.


Identifying, the wave pattern in the $ES_F remains challenging and the market refuses to show it's had. Until it does, all we can do is focus on one wave at a time until enough data enables the wave structure to be clearly identified.


As of the close, my best interpretation remains an expanding diagonal. If you have been reading my posts you know that the pattern has flaws. See last Wednesday's blog post for details. As of the close of Friday's trade, the weekly chart level shows the current wave labeling. Notice this week's price bar , called a "spinning top" to candlestick traders. The small real body shows that neither the bulls or bears were able to gain control. The implication is that a spinning top immediately proceeds trend losing momentum.  If this was the case we would expect a move up for the early part of next week.


The above chart shows the bullish expectations, given the spinning top at the weekly chart level. However, when I look at Friday's session, I see weakness as price closed near the lows of the session. Add your favorite momentum indicator and you will see trending momentum to the downside that contradicts the weekly implications of the spinning top. RSI is currently 44.66 and hasn't broken the 40 level which would imply that a larger decline was unfolding.  Also note that the decline from w.iii circle has been contained within a corrective price channel; is choppy and that four waves have been completed within it. The structure SHOULD be viewed as corrective.


Ok, corrections can't end in four waves so here's what I think will unfold under a near term bearish scenario. I've only labeled the waves from w.4 red low but I want you to focus only on what unfolds from 1367.25 high. If a double zig-zag unfolds as I have indicated, then I'm looking for w.(a) of w.z to terminate near 1318.25- 1317.75 for tomorrow's trade that will be followed by w.(b) up and a final round of selling to where w.z = w.w at 1294.25. Note nearby structural support of 1290.25 and the .618 retracement of 1290.50 are nearby.

In conclusion, I've given a bulls and bearish view. What should be exciting to you if you are a bull is that we know that eventually the market will make a new recovery high under either view. Only a loss of 1290.50 would imply that a more significant decline was underway and that a more aggressive bearish posture would be adopted.

I hope you found this information helpful and best of trading.

Wednesday, May 18, 2011

The Market Pulse

As most investors and traders alike have been whipsawed by the up/down gyrations that the Market has dished out. Those following the Elliott Wave Principle know that the "Principle" provides the methodology to determine the Market's position.


Right or wrong on the wave count, the market has moved up/down in three wavelike structures from 1243.25. The expanding diagonal interpretation at the weekly and daily chart level has flaws. Absent of another identifiable wave structure, I'm sticking with it until price says I'm wrong.

 Looking at the daily chart, each decline (1335.75- 1290.25) and (1367.25 - 1316) is too short, i.e. that the retracements according to the guidelines call for w.ii and w.iv should be .66 - .81 % of the proceeding wave. Both waves never challenged the 61.8% retracement. Also, w.iii circle should be longer than w.i. it isn't.

One clue that w.v is underway should be an increase in volume. Although I haven't shown it, volume was light during today's session and will need to pick up or another flaw may be developing. However, PRICE ultimately has the final say. 

In conclusion, the count has issues but as long as we focus on one wave at a time we'll remain on the right side of the market. As of the time of this post, the Market has completed another three waves up from 1316 but looks to be making a fourth wave correction that would have us looking higher for the remainder of the ON session... possibly into tomorrow's daily session.

Let's see what tomorrow brings.

Before The Bell: $ES_F Intraday Chart


This chart is a follow up to yesterday's session and my previous analysis.... calling for 1314 bottom. Notice the support levels of 1314.5 and 1319.75. The Market traded to 1316 the end of w.iv circle. The wave pattern from w.iii circle counts well as a zig zag which are usually found within diagonal patterns. Notice that the subdivisions also count well for w.(c) of w.iv circle. However, the ON session's price action looks choppy and also corrective. Be on guard that the move to 1316 is only part of a larger structure and that we have not seen the end of selling. If the count is indeed correct, then 1316 is critical support. One tick below and the interpretation is suspect.

I hope you found this information helpful and...

Best of Trading.

Tuesday, May 17, 2011

ES_F : Updated Chart


Last night's post expressed my opinion that traders should look lower for today's session and to target 1314. Today the market has traded to 1316, just two points shy of a potential w.iv circle low. I have been away from the market for most of the day and have not been able to looked at the intraday charts. Therefore I can't confirm that the wave count actually validates a w.iv circle termination.  I hope to update the count later tonight or at the latest before the next daily session.

Best of Trading

Monday, May 16, 2011

The Market Pulse


Not much has changed since my weekly forecast that I posted on Sunday. If you missed it, watch the video

The above chart includes today's session, where the market seesawed back and forth before logging another down day.  


.. and here is the daiy chart level. Notice that today's price action closed below  w.iv circle and thus the previous wave labeling has been rendered incorrect. However, the ending diagonal interpretation is still viable until 1290.25 is broken.


Sticking with the ending diagonal pattern, if w.iv is still unfolding,  then w.(c) = w.(a) at 1314.5 for ES1-057 and 1310 for the front month contract. I've redrawn the lower trendline to show how the elliott wave pattern would shift to that of a possible expanding diagonal, a pattern that is rare. There are other interpretations that will be discussed should 1290.25 be breached on a closing basis.

For tomorrow, look lower.


Best of Trading

Sunday, May 15, 2011

Heard On The Street

The Emini SP future's most recent price action is perplexing. As of Friday's close, the Elliott wave pattern and count is unclear. Watch this brief video to find out how I approach a market when my wave interpretations don't match a high number of rules and guidelines.

Wednesday, May 11, 2011

$HG_F: Is the Copper rally still intact?


The above chart includes the wave count that I was working where I was looking for w.iv circle to complete around the 395-97 area and then the final leg of the Copper rally would unfold according to my previous interpretation where Copper would top at 500.9. That's not what is unfolding. As you can see, price has traded sharply lower and now threatens the count or at least has me pondering whether Copper made a Grand Supercycle  top .... w.III circle at 464.95 (in what I was calling w.(3)). 

Let's see what unfolds today and I'll update readers in tonight's emini SP update.

I hope you found this information helpful and ....


Best of Trading

$ES_F: Updated Chart


The last time we spoke about the ES_F, I left readers with an ending diagonal interpretation where w.iv circle had completed and I was looking for an up down up sequence to complete the pattern. Above is the chart. Notice that price did push higher.


 At the 240 min chart level of the front month contract, the overnight session pushed to where w.(c) = w.(a ) to complete w.a circle at 1358.25. I'm looking for an initial decline to the target box that represents 1343.50 - 1345.75, that will be followed by a three wave countertrend move, then a final round of selling to the .618 retracement of 1325.25 to 1358.25.  As soon as w.(a) of this initial decline has completed, additional fib termination points will be provided and discussed.

Best of Trading


Tuesday, May 10, 2011

The Market Pulse

Today's post will be brief and a supplement to the weekly edition of Heard On The Street.


The Emini S&P appear to be following the script laid out calling for an ending diagonal. Yesterday, prices rallied and RSI has so far failed to break the 40 line , a point where further bullishness would be questioned. The fact that the indicator bounced of the 50 line instead of even testing the lower 40 line bolsters my bullish view.


At the intraday level, the subdivisions of w.5 are labeling and I am expecting another up, down up sequence to complete the pattern.

I hope you found this information helpful and ...

Best of Trading

Sunday, May 8, 2011

Heard on The Street: $ES_F $DX_F $EUR_USD #Crb Index #Commodities #FX

Three Pressing Questions that YOU Might Be Asking

  • Commodities had a terrible week. Is the trend over or is the Market just offering another lower entry point?

  • Has the long awaited turn in the USD arrived or was the past weeks price action just another fake out? 

  • Will "Sell In May and Go Away Theory" lead to a substantial correction?

Watch this video edition of Heard On The Street for the answers you seek and gain insight into where each market may be headed.


Friday, May 6, 2011

Chart of the Day: EUR-USD


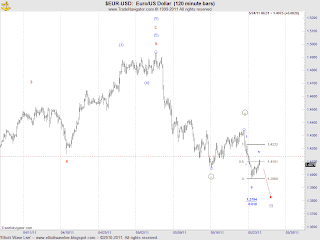
The EUR-USD has completed a trend sequence that began on 1/10/11... w.(B). Price action over the early part of May appears to unfolded in an expanding diagonal. This would explain the swift decline as price action of waves that follows a diagonal quickly retraces back to the origin of where the pattern began or 1.4157.


Dropping down to the intraday chart level, the structure of the expanding diagonal can be clearly seen.  The decline from 1.4936 counts well as an impulsive wave where w.(iii) is complete and w.(iv) appears to be unfolding in a triangle or possibly an expanded flat that adheres to the rules of alternation due to the fact that w.(ii) was a sharp corrective move. For today, look sideways or up to a maximum of 1.4617 for w.(iv). Thereafter another round of selling should draw prices to the 1.4157 target to complete w.i circle.

I hope you found this information helpful and...

Best of Trading

Wednesday, May 4, 2011

The Market Pulse


The ES_F wave count boils down to one simple thing... wave overlap. Should the market print below 1335.75, then the rally from 1243 to 1367.25 will be confirmed complete in three wave and opens up two alternatives which I will discuss later in this update.  Until that event occurs, the preferred count has the market pushing higher in w.5 to the listed targets.

Alternate Counts:

Running Triangle


Under this interpretation, look for the market to retrace each previous swing by the 618 multiple. In doing so, the expanded flat interpretation (below) would then be eliminated. At a minimum, I'm looking lower for a test of 1290.5 for w. c.


Expanded Flat


Under this interpretation w.c of w.4 is underway and should unfold in an impulsive manner... targeting 1196-1214  with 1205.85 being the most common wave relationship where w.c = 1.618 w.a. Once complete, expect a new recovery high.


One area of concern for both alternate counts is that w.4, when complete, will be too large (time relationships) v.s. it's brethren w.2. So possibly a larger degree pattern is unfolding... one that will need more data to determine the validity of such a proposal.


I hope you found this information helpful and ...

Best of Trading

Chart of the Day: Sugar

The most recent sell-off in the commodity space has been volatile in the high flying names like Gold, Silver, Copper and Crude Oil but if you trade commodities, you've probably noticed that most members of the grains and softs group created tradeable tops in February - April.


Today, Sugar illustrates my point as the market topped on 2/2/11 and is now working a five wave decline. Currently, w.3 of w.(3) is very mature and I expect w.3 to complete at 20.46, where w.v of w.3 = .618 {w.(i-iii)}. Once complete, w.4 will unfold in a sideways correction where w.4 = (.383-.5) w.3 between 20.39-24.31. Also note that the previous w.iv of one lesser degree surrounds these key areas and provides a possible short trade setup as a print above 25.47 (previous w.1) invalidates the count and tells us where we are wrong.


We can also find a similar pattern if the iPath Sugar ETF. Without repeating myself, the key targets are the same as the Sugar futures contract.

I hope you found this information helpful and ....

Best of Trading

Monday, May 2, 2011

The Market Pulse

Recent price action supports the larger degree weekly wave patterns set forth in 4/24/2011 edition of Heard On The Street. If you missed that video click here to review the analysis. Tonight's post is going to be a combination of my weekly edition of Heard On The Street and the daily perspective.


At the weekly chart level, the market reached the next cited target zone where w.5 = w.1 at 1364 and the 1.236 RF extension of w.3 and w.4 (1343 -1243.25) at 1366.5. Also note that the Detrend Osc. challenged upper resistance and has turned down. This was expected if the fib zone was to provide  resistance to further price appreciation. However, the bullish count could still be subdividing and today's decline is only a minor set-back that will be quickly recovered (see bullish count below).


While today's decline was minor in terms of points, the alternate count is still viable. Another alternate is that w.4 will unfold in an expanded flat (not shown). Watch for the sell off to pick up steam if this count is unfolding.


At the intraday chart level,  the subdivisions indicate that w.(v) of w.5 was an extended wave, however as I mentioned earlier, the bullish count could still be subdividing as indicated by the alternate count where today's high marked w.(iii) and where w.(iv) is now unfolding. Once complete, the rally will resume for a possible test of 1372 (see weekly chart above). Over the next few trading days the wave pattern should resolve. In the interim, look sideways to down for tomorrow.

I hope you found this information helpful and...

Best of Trading