Thursday, August 30, 2012

Why FED Will Not Disappoint


 "The Boys Club of Wall Street Cronies"

Already Know The Outcome. We Don't! 

The general market has been range bound leading up to the Fed’s annual symposium in Jackson Hole, Wyoming. For weeks I've been looking for clues as to whether or not the central bank will use the address to pave the way for another round of monetary stimulus via quantitative easing or asset purchases.

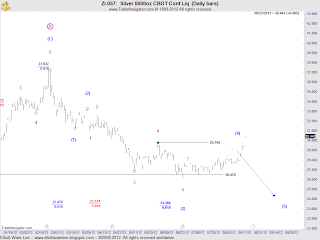
Yesterday I gave my opinion on Gold  . Charts of silver are similar in nature. My trading plan requires another up sequence to complete what I believe is a corrective pattern. If that statement implies that recent price appreciation has built in a positive FED announcement and a sell the news event occurs, then so be it. 

Regardless of what the FED states, does or doesn't do, the charts tell me that each market should rally into my target zones and then fail. As such, I don't believe that the FED statement will take further easing off the table but the won't commit to it either therefore aligning the wave pattern top with the news event. 

I'll be monitoring gold and silver for further evidence that a fourth wave is completing. Should gold and silver trade above 1677.5 and 31.10 respectively before the market closes, it most certainly will make tomorrow even more interesting. 

Best of Trading

======================================================================

ElliottwaveLive is not an investment advisory service or broker dealer. None of its contributors are registered investment advisors, licensed stock brokers or CTA's. The author may hold short term and long term positions in the futures, stocks and ETF's discussed herein. The author may also trade around those positions which may be in direct conflict with your positions. Complete trade disclosures of the contributor’s holdings are posted at www.elliottwavelive.blogspot.com. See Trader Disclosure. 

Trade at your own risk. The blog site, Newsletter and all other information, material and content accessible from this Site (collectively, the "Content")  provided herein provides the context for market analysis with respect to a market's, a security or a commodity's general position utilizing the Elliott Wave Principle. The Content contained herein are the opinion and general comments of the author and is based upon information that Mr. Sinibaldi considers reliable but neither ElliottWaveLive nor he warrants it's completeness or accuracy and it should not be relied upon as such. Mr. Sinibaldi or ElliottWaveLive (collectively, referred to as “EWL”) are not under any obligation to update or correct any content provided on this website. Any statements and or opinions are subject to change without notice. The content and comments contained herein neither purports nor intends to be, specific trading advice. It has been prepared without regard to any particular person's investment objectives, financial situation and particular needs. Information should not be considered as an offer or enticement to buy, sell or trade. 

A more and comprehensive Risk Disclaimer and Disclosure Statements is available within the left margin of this blog site.   


======================================================================
Fair Disclosure Notice: I do not have a position in any of the aforementioned futures markets or  securities related to this article. 

Tuesday, August 28, 2012

FED Hope of Easing Sparks False Rally in Gold

Just about a month ago I provided my personal assessment of gold. Elliott Wave Live: Is There Gold Still In Those Hills?


The above chart is the interpretation along with recent price action. As I stated within the previous post, "Prints above 1642.4 negate the interpretation."

A False Rally?


While my interpretation was proven incorrect, the concept of a triangular formation was not. Here's why...


At the daily chart level, I have adjusted my wave count. Readers should be able to identify the sideways movement within the chart. If you are following the rules and guidelines set forth by the Elliott Wave Principle, there is no way to label this pattern as impulsive.   Therefore, IMO, the best wave interpretation to date is an A-B-C correction with a triangle w.b circle that needs to prove itself to me by not exceeding 1707.8.


Further Evidence


Both the CBOE Gold Index and Gold Miners charts above have a shaded region that at the time of this post also exhibit possible corrective flat patterns. That would imply another move up above the June 2012 peaks. 


In conclusion, I'm not buying into this move regardless of what the FED does. I'm a possible buyer at lower levels as the larger degree pattern requires further downside as shown here. 

I hope you found this article helpful.

Best of Trading

======================================================================

ElliottwaveLive is not an investment advisory service or broker dealer. None of its contributors are registered investment advisors, licensed stock brokers or CTA's. The author may hold short term and long term positions in the futures, stocks and ETF's discussed herein. The author may also trade around those positions which may be in direct conflict with your positions. Complete trade disclosures of the contributor’s holdings are posted at www.elliottwavelive.blogspot.com. See Trader Disclosure. 

Trade at your own risk. The blog site, Newsletter and all other information, material and content accessible from this Site (collectively, the "Content")  provided herein provides the context for market analysis with respect to a market's, a security or a commodity's general position utilizing the Elliott Wave Principle. The Content contained herein are the opinion and general comments of the author and is based upon information that Mr. Sinibaldi considers reliable but neither ElliottWaveLive nor he warrants it's completeness or accuracy and it should not be relied upon as such. Mr. Sinibaldi or ElliottWaveLive (collectively, referred to as “EWL”) are not under any obligation to update or correct any content provided on this website. Any statements and or opinions are subject to change without notice. The content and comments contained herein neither purports nor intends to be, specific trading advice. It has been prepared without regard to any particular person's investment objectives, financial situation and particular needs. Information should not be considered as an offer or enticement to buy, sell or trade. 

A more and comprehensive Risk Disclaimer and Disclosure Statements is available within the left margin of this blog site.   


======================================================================
Fair Disclosure Notice: I do not have a position in any of the aforementioned futures markets or  securities related to this article. 


Monday, August 27, 2012

Will Another Leader Fall?


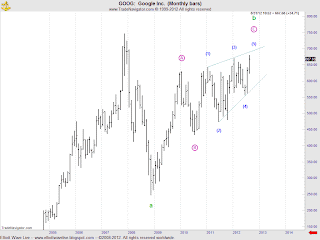
Google (ticker GOOG) has been tracking a bearish ending diagonal within an A-B-C correction that should resolve with a swift move to the downside. Price has made a recovery high that looks incomplete BUT the level is interesting as w. C circle = .618 w.A circle. A decline below 556.52 before any further recovery high would, at a minimum, confirm that rally from w.B circle was complete.

At the larger cycle degree, the wave interpretation would imply an eventual decline to below w.a. 

Best of Trading


======================================================================

ElliottwaveLive is not an investment advisory service or broker dealer. None of its contributors are registered investment advisors, licensed stock brokers or CTA's. The author may hold short term and long term positions in the futures, stocks and ETF's discussed herein. The author may also trade around those positions which may be in direct conflict with your positions. Complete trade disclosures of the contributor’s holdings are posted at www.elliottwavelive.blogspot.com. See Trader Disclosure. 

Trade at your own risk. The blog site, Newsletter and all other information, material and content accessible from this Site (collectively, the "Content")  provided herein provides the context for market analysis with respect to a market's, a security or a commodity's general position utilizing the Elliott Wave Principle. The Content contained herein are the opinion and general comments of the author and is based upon information that Mr. Sinibaldi considers reliable but neither ElliottWaveLive nor he warrants it's completeness or accuracy and it should not be relied upon as such. Mr. Sinibaldi or ElliottWaveLive (collectively, referred to as “EWL”) are not under any obligation to update or correct any content provided on this website. Any statements and or opinions are subject to change without notice. The content and comments contained herein neither purports nor intends to be, specific trading advice. It has been prepared without regard to any particular person's investment objectives, financial situation and particular needs. Information should not be considered as an offer or enticement to buy, sell or trade. 

A more and comprehensive Risk Disclaimer and Disclosure Statements is available within the left margin of this blog site.   

Soybeans: Follow Up

In my August 7, 2012 post I was looking lower in beans Elliott Wave Live: Soybeans Lower? . That short term outlook provided the initial context for the decline that followed....


.... but that decline fell short of reaching it's objective in what I believe was a failed w.c. Since then, the market has exploded higher in w.5 which is in need of another up, down up sequence to complete. The most logical target for w.iii =1.618 w.i @ 1766^2.


The combined chart offers a slightly higher projected target for w.iii @1769^4. 

Look for the next update after w.iii objectives are met. 

Best of Trading


======================================================================

ElliottwaveLive is not an investment advisory service or broker dealer. None of its contributors are registered investment advisors, licensed stock brokers or CTA's. The author may hold short term and long term positions in the futures, stocks and ETF's discussed herein. The author may also trade around those positions which may be in direct conflict with your positions. Complete trade disclosures of the contributor’s holdings are posted at www.elliottwavelive.blogspot.com. See Trader Disclosure. 

Trade at your own risk. The blog site, Newsletter and all other information, material and content accessible from this Site (collectively, the "Content")  provided herein provides the context for market analysis with respect to a market's, a security or a commodity's general position utilizing the Elliott Wave Principle. The Content contained herein are the opinion and general comments of the author and is based upon information that Mr. Sinibaldi considers reliable but neither ElliottWaveLive nor he warrants it's completeness or accuracy and it should not be relied upon as such. Mr. Sinibaldi or ElliottWaveLive (collectively, referred to as “EWL”) are not under any obligation to update or correct any content provided on this website. Any statements and or opinions are subject to change without notice. The content and comments contained herein neither purports nor intends to be, specific trading advice. It has been prepared without regard to any particular person's investment objectives, financial situation and particular needs. Information should not be considered as an offer or enticement to buy, sell or trade. 

A more and comprehensive Risk Disclaimer and Disclosure Statements is available within the left margin of this blog site.   


Friday, August 24, 2012

Mini DOW

For those who are interested in learning how the wave principle can be used to project movement in the markets, here is a quick training exercise and what I was looking at over the last few days.


First and foremost, I like to set up my Fibonacci grid as shown above before I apply any wave labeling. The minor support zones have been removed from the chart but feel free to use your own software to see where other ares of support were present and how the market reacted off those levels.

Most readers know that I have been looking for a minimal decline to 13006. As of the time of this post, the market fell to 13011. With a typical 3 point front-run and 13014 minor support just above my key level, support may be holding.


At the 60-min chart level, my preferred count shows why I was looking at 13006 as well as the possibility that the alternate count could be applicable if the market rotates strongly from 13006. As always, applying wave counts to extending waves in real-time can be somewhat difficult and often leads to revisions in the subdivisions of waves. As labeled w.i = w.iii at 13006. 

I'll be watching the reaction off 13011 or 13006. Under my preferred count, if 13006 is achieve, I'm looking for price to rotate 13055-86 before another round of selling. As you know, 4th waves can not enter into the territory of wave 1, therefore, a print above 13099 invalidates the preferred count. 

I hope you found this real time training exercise helpful. 


Best of Trading


======================================================================
ElliottwaveLive is not an investment advisory service or broker dealer. None of its contributors are registered investment advisors, licensed stock brokers or CTA's. The author may hold short term and long term positions in the futures, stocks and ETF's discussed herein. The author may also trade around those positions which may be in direct conflict with your positions. Complete trade disclosures of the contributor’s holdings are posted at www.elliottwavelive.blogspot.com. See Trader Disclosure. 

Trade at your own risk. The blog site, Newsletter and all other information, material and content accessible from this Site (collectively, the "Content")  provided herein provides the context for market analysis with respect to a market's, a security or a commodity's general position utilizing the Elliott Wave Principle. The Content contained herein are the opinion and general comments of the author and is based upon information that Mr. Sinibaldi considers reliable but neither ElliottWaveLive nor he warrants it's completeness or accuracy and it should not be relied upon as such. Mr. Sinibaldi or ElliottWaveLive (collectively, referred to as “EWL”) are not under any obligation to update or correct any content provided on this website. Any statements and or opinions are subject to change without notice. The content and comments contained herein neither purports nor intends to be, specific trading advice. It has been prepared without regard to any particular person's investment objectives, financial situation and particular needs. Information should not be considered as an offer or enticement to buy, sell or trade. 

A more and comprehensive Risk Disclaimer and Disclosure Statements is available within the left margin of this blog site.   


Silver Tongue Chart : Update

Silver is popping today and as I mentioned a few days ago, the metals had my full attention due to the fact that the FED minutes might indicate further QE. The following link Elliott Wave Live: Silver Tongue Chart  provided my initial comments on Silver.


The above chart shows that I was looking for an up, down sequence to complete a w.C=w.A move to 23.47. That didn't happen. However, that doesn't mean that my count is invalidated. The count invalidates on a print above the w.(1) low of 31.222 due to the fact that in motive waves, w.(4) never moves beyond the end of w.(1).  Yet, other clues suggest this interpretation is wrong. Here's why.....

  • Applying time factors diminishes the probability of this count as the length of time consumed by w.(4) is much longer than w.(2). W.(2) is 8 bars long while w.(4) has reached 41 bars and is still incomplete. 
  • From a proportional view, w.(4) is much larger.  


So what are the other scenarios? Are we in full bull mode or is this a counter trend move that will be fully retraced?


The alternate that I offered in my initial post has been applied to the weekly chart level as it's possible that the alternate scenario will play out and if so, price will make new lows. The fact of the matter is that it doesn't really matter if this market is in full bull mode because I'm looking to buy this market anyway and the location of my entry as well as my stop placement is what matters.

Once this advance ends the next move down will tell all. Should it be in three waves, I'm a buyer against the lows. If the decline is in five waves, then I'm a buyer at lower levels.

As always, I'll continue to monitor this chart and provide updates so that you can learn how I'm applying Elliott Wave Principle.

Best of Trading


======================================================================
ElliottwaveLive is not an investment advisory service or broker dealer. None of its contributors are registered investment advisors, licensed stock brokers or CTA's. The author may hold short term and long term positions in the futures, stocks and ETF's discussed herein. The author may also trade around those positions which may be in direct conflict with your positions. Complete trade disclosures of the contributor’s holdings are posted at www.elliottwavelive.blogspot.com. See Trader Disclosure. 

Trade at your own risk. The blog site, Newsletter and all other information, material and content accessible from this Site (collectively, the "Content")  provided herein provides the context for market analysis with respect to a market's, a security or a commodity's general position utilizing the Elliott Wave Principle. The Content contained herein are the opinion and general comments of the author and is based upon information that Mr. Sinibaldi considers reliable but neither ElliottWaveLive nor he warrants it's completeness or accuracy and it should not be relied upon as such. Mr. Sinibaldi or ElliottWaveLive (collectively, referred to as “EWL”) are not under any obligation to update or correct any content provided on this website. Any statements and or opinions are subject to change without notice. The content and comments contained herein neither purports nor intends to be, specific trading advice. It has been prepared without regard to any particular person's investment objectives, financial situation and particular needs. Information should not be considered as an offer or enticement to buy, sell or trade. 

A more and comprehensive Risk Disclaimer and Disclosure Statements is available within the left margin of this blog site.   


Friday, August 10, 2012

Chinese Trade Data : Shanghai Index Update


Today we have trade data from China that was worse than expected and I thought that today would be a good time to update my charts which appear to be following my preferred wave count identified in my three part series ....  Global Bear or Bull Market?

You can read  more about the first two parts of the series here:

 Part I: http://bit.ly/LS12pz
Part II: http://bit.ly/MrsNW

Stay tuned for Part III.

Best of Trading


======================================================================
ElliottwaveLive is not an investment advisory service or broker dealer. None of its contributors are registered investment advisors, licensed stock brokers or CTA's. The author may hold short term and long term positions in the futures, stocks and ETF's discussed herein. The author may also trade around those positions which may be in direct conflict with your positions. Complete trade disclosures of the contributor’s holdings are posted at www.elliottwavelive.blogspot.com. See Trader Disclosure. 

Trade at your own risk. The blog site, Newsletter and all other information, material and content accessible from this Site (collectively, the "Content")  provided herein provides the context for market analysis with respect to a market's, a security or a commodity's general position utilizing the Elliott Wave Principle. The Content contained herein are the opinion and general comments of the author and is based upon information that Mr. Sinibaldi considers reliable but neither ElliottWaveLive nor he warrants it's completeness or accuracy and it should not be relied upon as such. Mr. Sinibaldi or ElliottWaveLive (collectively, referred to as “EWL”) are not under any obligation to update or correct any content provided on this website. Any statements and or opinions are subject to change without notice. The content and comments contained herein neither purports nor intends to be, specific trading advice. It has been prepared without regard to any particular person's investment objectives, financial situation and particular needs. Information should not be considered as an offer or enticement to buy, sell or trade. 

A more and comprehensive Risk Disclaimer and Disclosure Statements is available within the left margin of this blog site.   


Thursday, August 9, 2012

ES Setup From Low


Often pre-market setups aren't worth bothering with due to lack of volume and the fact that on any given day economic reports are due out. Therefore, I send most of my time scanning markets for potential trade setups that I might consider during the regular session.

Today, I came across this set up in the eminis, that was perfect for illustrating how I use elliott wave to trade. 

Note: This is a hypothetical trade that was made for training purposes!

DETAILS:
  1. I saw a pattern that I recognized as a w-x-y that completed where w.y = w.w at 1393.75 with .786 support  and 1390.5 swing low directly below the market. 
  2. Entry at 1395.25, (2) cars, initial stop at 1393.50


My initial target for this trade was 1398, then a test of 1400's. 


Dropping to the 1-min chart, you can see the first objective was reached where I took off one contract for 2.25 pts or $112.5. I got caught on the second contract looking for the market to subdivide higher. Notice the initial decline from 1398 was sharp! I could have exited earlier but I wanted to illustrate  how the market always gives you another opportunity to get out before it buries you. The key is "not to panic"!

Since all market movement is either in three or five waves, you look to get out on the first retracement. As shown, I exited just above the .382 retracement at 1396.75 for 3/4 pt or $75.

You might ask why I didn't wait for the .618 to exit.  Something to ponder! What if you're still waiting for that level? 


TRADE RESULTS:

(2) contracts
3.75 pts profit
$187.50


Best of Trading 


======================================================================
ElliottwaveLive is not an investment advisory service or broker dealer. None of its contributors are registered investment advisors, licensed stock brokers or CTA's. The author may hold short term and long term positions in the futures, stocks and ETF's discussed herein. The author may also trade around those positions which may be in direct conflict with your positions. Complete trade disclosures of the contributor’s holdings are posted at www.elliottwavelive.blogspot.com. See Trader Disclosure. 

Trade at your own risk. The blog site, Newsletter and all other information, material and content accessible from this Site (collectively, the "Content")  provided herein provides the context for market analysis with respect to a market's, a security or a commodity's general position utilizing the Elliott Wave Principle. The Content contained herein are the opinion and general comments of the author and is based upon information that Mr. Sinibaldi considers reliable but neither ElliottWaveLive nor he warrants it's completeness or accuracy and it should not be relied upon as such. Mr. Sinibaldi or ElliottWaveLive (collectively, referred to as “EWL”) are not under any obligation to update or correct any content provided on this website. Any statements and or opinions are subject to change without notice. The content and comments contained herein neither purports nor intends to be, specific trading advice. It has been prepared without regard to any particular person's investment objectives, financial situation and particular needs. Information should not be considered as an offer or enticement to buy, sell or trade. 

A more and comprehensive Risk Disclaimer and Disclosure Statements is available within the left margin of this blog site.   


HYPOTHETICAL TRADING DISCLOSURE

CFTC RULE 4.41 - HYPOTHETICAL OR SIMULATED PERFORMANCE RESULTS HAVE CERTAIN LIMITATIONS. UNLIKE AN ACTUAL PERFORMANCE RECORD, SIMULATED RESULTS DO NOT REPRESENT ACTUAL TRADING. ALSO, SINCE THE TRADES HAVE NOT BEEN EXECUTED, THE RESULTS MAY HAVE UNDER-OR-OVER COMPENSATED FOR THE IMPACT, IF ANY, OF CERTAIN MARKET FACTORS, SUCH AS LACK OF LIQUIDITY, COMMISSION AND SLIPPAGE. SIMULATED TRADING PROGRAMS IN GENERAL ARE ALSO SUBJECT TO THE FACT THAT THEY ARE DESIGNED WITH THE BENEFIT OF HINDSIGHT. NO REPRESENTATION IS BEING MADE THAT ANY ACCOUNT WILL OR IS LIKELY TO ACHIEVE PROFIT OR LOSSES SIMILAR TO THOSE SHOWN.NO REPRESENTATION IS BEING MADE THAT ANY ACCOUNT WILL, OR IS LIKELY TO ACHIEVE PROFITS OR LOSSES SIMILAR TO THOSE DISCUSSED WITHIN THIS SITE, SUPPORT AND TEXTS. OUR POST(S), SHOULD BE USED AS LEARNING AIDS ONLY AND SHOULD NOT BE USED TO INVEST REAL MONEY. IF YOU DECIDE TO INVEST REAL MONEY, ALL TRADING DECISIONS SHOULD BE YOUR OWN.


Tuesday, August 7, 2012

Soybeans Lower?

I thought I would expand a bit upon a tweet I made on August 3, 2012, where I said, " Any way u cut the fish,  going lower. Any temp. strength will be negated."


The basis for my opinion was due to the fact that the wave structure from 7/24 - 7/31 appeared to be in three waves and thus a corrective rally. If my assessment was correct then a significant decline could ensure and thus the "context" for my comment after the 8/2/2102 close. 

Note: that temporary strength was indeed negated and yesterday price turned south

From the 1656 high, the decline should unfold in a five wave decline. The pattern would be confirmed on a closing bases below 1552^2. If not, the possibility remains that we will see a complex corrective pattern developing from 1690... possibly a triangle that would eventually reach a new recovery high.

I hope you found this information helpful and...

Best of Trading 

======================================================================
ElliottwaveLive is not an investment advisory service or broker dealer. None of its contributors are registered investment advisors, licensed stock brokers or CTA's. The author may hold short term and long term positions in the futures, stocks and ETF's discussed herein. The author may also trade around those positions which may be in direct conflict with your positions. Complete trade disclosures of the contributor’s holdings are posted at www.elliottwavelive.blogspot.com. See Trader Disclosure. 

Trade at your own risk. The blog site, Newsletter and all other information, material and content accessible from this Site (collectively, the "Content")  provided herein provides the context for market analysis with respect to a market's, a security or a commodity's general position utilizing the Elliott Wave Principle. The Content contained herein are the opinion and general comments of the author and is based upon information that Mr. Sinibaldi considers reliable but neither ElliottWaveLive nor he warrants it's completeness or accuracy and it should not be relied upon as such. Mr. Sinibaldi or ElliottWaveLive (collectively, referred to as “EWL”) are not under any obligation to update or correct any content provided on this website. Any statements and or opinions are subject to change without notice. The content and comments contained herein neither purports nor intends to be, specific trading advice. It has been prepared without regard to any particular person's investment objectives, financial situation and particular needs. Information should not be considered as an offer or enticement to buy, sell or trade. 

A more and comprehensive Risk Disclaimer and Disclosure Statements is available within the left margin of this blog site.   


Monday, August 6, 2012

Crude Oil: Our Worst Fear


On Friday I said, "Our biggest fear:  battle royal. Setting up for a monster directional trade. Which way? Find out in this video.


Best of Trading


======================================================================
ElliottwaveLive is not an investment advisory service or broker dealer. None of its contributors are registered investment advisors, licensed stock brokers or CTA's. The author may hold short term and long term positions in the futures, stocks and ETF's discussed herein. The author may also trade around those positions which may be in direct conflict with your positions. Complete trade disclosures of the contributor’s holdings are posted at www.elliottwavelive.blogspot.com. See Trader Disclosure. 

Trade at your own risk. The blog site, Newsletter and all other information, material and content accessible from this Site (collectively, the "Content")  provided herein provides the context for market analysis with respect to a market's, a security or a commodity's general position utilizing the Elliott Wave Principle. The Content contained herein are the opinion and general comments of the author and is based upon information that Mr. Sinibaldi considers reliable but neither ElliottWaveLive nor he warrants it's completeness or accuracy and it should not be relied upon as such. Mr. Sinibaldi or ElliottWaveLive (collectively, referred to as “EWL”) are not under any obligation to update or correct any content provided on this website. Any statements and or opinions are subject to change without notice. The content and comments contained herein neither purports nor intends to be, specific trading advice. It has been prepared without regard to any particular person's investment objectives, financial situation and particular needs. Information should not be considered as an offer or enticement to buy, sell or trade. 

A more and comprehensive Risk Disclaimer and Disclosure Statements is available within the left margin of this blog site.   

Saturday, August 4, 2012

Coffee Update and a Review of Wave Personality


After a volatile month of July, a review of the the decline from 192.2 has not yet proven itself. One could come to the conclusion that this market remains under pressure and you would probably be correct in your assessment. To what extent?

If the pressure truly remains to the downside and 150.10 will be surrendered, price action over the next two trading days must exhibit the personality of a third wave move.

From the 240 min chart, I have labeled what type of price action represents a third wave move AND what would not constitute one. In a third wave, we should see several days of heavy selling as price extends to the downside in long bars. This would bolster my labeling and my interpretation offered in my personal trade plan.You can read more about that trade plan at :  Elliott Wave Live: Coffee Anyone?

If we don't start seeing this market extend and see what I have described as "Not This", the possibility exists that either the bottom is already in or a more complex corrective move may be unfolding.

In conclusion, the correct use of Elliott Wave balances price with wave personality (structure). So make sure that you apply the applicable rule of wave personality to your wave labeling efforts. You'll see better results!

I hope you found this education tip helpful and...

Best of Trading


======================================================================
ElliottwaveLive is not an investment advisory service or broker dealer. None of its contributors are registered investment advisors, licensed stock brokers or CTA's. The author may hold short term and long term positions in the futures, stocks and ETF's discussed herein. The author may also trade around those positions which may be in direct conflict with your positions. Complete trade disclosures of the contributor’s holdings are posted at www.elliottwavelive.blogspot.com. See Trader Disclosure. 

Trade at your own risk. The blog site, Newsletter and all other information, material and content accessible from this Site (collectively, the "Content")  provided herein provides the context for market analysis with respect to a market's, a security or a commodity's general position utilizing the Elliott Wave Principle. The Content contained herein are the opinion and general comments of the author and is based upon information that Mr. Sinibaldi considers reliable but neither ElliottWaveLive nor he warrants it's completeness or accuracy and it should not be relied upon as such. Mr. Sinibaldi or ElliottWaveLive (collectively, referred to as “EWL”) are not under any obligation to update or correct any content provided on this website. Any statements and or opinions are subject to change without notice. The content and comments contained herein neither purports nor intends to be, specific trading advice. It has been prepared without regard to any particular person's investment objectives, financial situation and particular needs. Information should not be considered as an offer or enticement to buy, sell or trade. 

A more and comprehensive Risk Disclaimer and Disclosure Statements is available within the left margin of this blog site.   

Friday, August 3, 2012

Using Wave Patterns In Isolation: Aussie Dollar


All too often I see  traders struggle with longer term wave patterns. Their desire to correctly label the chart often leads to one's inability to be nimble. 

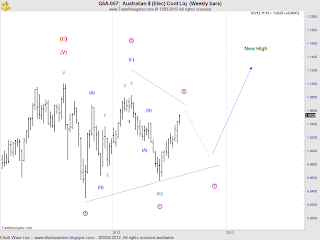
The weekly chart of the Aussie Dollar shows a triangular wave pattern. All an elliottician needs to know is that  price should remain in a sideways fashion until the pattern resolves. Since, triangles can only be found in w.4 and w.B or w.e of a triangle, labeling the adjacent waves becomes irrelevant (except under 3 below) and we know that price will make a final thrust move to new highs in this case.

This frees up a trader's mind and allows one to trade the pattern! 

Since triangles are present right before a terminal move, traders have the following options when day trading triangles:

  1. Trade the three wave swing of w.b, w.c, w.d, w.e.
  2. Wait until w.e concludes and go long.
  3. Reverse after the trust out of the triangle reaches it's termination point.

Of course, you must follow your individual trade plan for entry. The wave principle is only a guide to market position and an anticipated market direction.  

In conclusion, I find that KISS (keeping it simple stupid) applies best to using elliott wave in isolation.  I've been wrong many times as to the duration of the move, but getting the initial direction correct improves the probability of a successful money making trade. 

I hope you found this lesson helpful and ...

Best of Trading


======================================================================
ElliottwaveLive is not an investment advisory service or broker dealer. None of its contributors are registered investment advisors, licensed stock brokers or CTA's. The author may hold short term and long term positions in the futures, stocks and ETF's discussed herein. The author may also trade around those positions which may be in direct conflict with your positions. Complete trade disclosures of the contributor’s holdings are posted at www.elliottwavelive.blogspot.com. See Trader Disclosure. 

Trade at your own risk. The blog site, Newsletter and all other information, material and content accessible from this Site (collectively, the "Content")  provided herein provides the context for market analysis with respect to a market's, a security or a commodity's general position utilizing the Elliott Wave Principle. The Content contained herein are the opinion and general comments of the author and is based upon information that Mr. Sinibaldi considers reliable but neither ElliottWaveLive nor he warrants it's completeness or accuracy and it should not be relied upon as such. Mr. Sinibaldi or ElliottWaveLive (collectively, referred to as “EWL”) are not under any obligation to update or correct any content provided on this website. Any statements and or opinions are subject to change without notice. The content and comments contained herein neither purports nor intends to be, specific trading advice. It has been prepared without regard to any particular person's investment objectives, financial situation and particular needs. Information should not be considered as an offer or enticement to buy, sell or trade. 

A more and comprehensive Risk Disclaimer and Disclosure Statements is available within the left margin of this blog site.   


ES_F Update:


I wanted to drop a quick not to readers regarding the pattern that has developed over the past few days in the eminis. Patterns that are difficult to identify typically are corrective but with all the recent volatility, including yesterdays move, I wanted to present an ending diagonal scenario that I am looking at. Notice that the key area of 1397.5 continues to stay in focus.... where w.c = w.a  to complete w.2 red. Breaks of w.(iv) low would negate this scenario and send me back to the drawing board.

Be careful out there today. 

If you have been following along, my previous comments can be reviewed here at:

Elliott Wave Live: ES_F Update:


Best of Trading

======================================================================
ElliottwaveLive is not an investment advisory service or broker dealer. None of its contributors are registered investment advisors, licensed stock brokers or CTA's. The author may hold short term and long term positions in the futures, stocks and ETF's discussed herein. The author may also trade around those positions which may be in direct conflict with your positions. Complete trade disclosures of the contributor’s holdings are posted at www.elliottwavelive.blogspot.com. See Trader Disclosure. 

Trade at your own risk. The blog site, Newsletter and all other information, material and content accessible from this Site (collectively, the "Content")  provided herein provides the context for market analysis with respect to a market's, a security or a commodity's general position utilizing the Elliott Wave Principle. The Content contained herein are the opinion and general comments of the author and is based upon information that Mr. Sinibaldi considers reliable but neither ElliottWaveLive nor he warrants it's completeness or accuracy and it should not be relied upon as such. Mr. Sinibaldi or ElliottWaveLive (collectively, referred to as “EWL”) are not under any obligation to update or correct any content provided on this website. Any statements and or opinions are subject to change without notice. The content and comments contained herein neither purports nor intends to be, specific trading advice. It has been prepared without regard to any particular person's investment objectives, financial situation and particular needs. Information should not be considered as an offer or enticement to buy, sell or trade. 

A more and comprehensive Risk Disclaimer and Disclosure Statements is available within the left margin of this blog site.