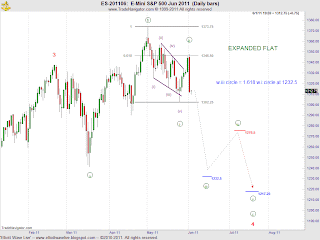
The wave count remains problematic as the decline from w.3 was in three waves. Subsequent price action was another three wave rally to new highs, five overlapping waves to the downside, and a three wave rally that ended at 1347.75. Given the depth of the decline today, I am beginning to favor the expanded flat interpretation yet the running triangle and the possibility that a top is in are still viable counts. As a reminder, I will not be discussing each interpretation until price action tells me to favor a particular count. At the daily chart level, notice that w.ii circle terminated right at the .618 retracement and within the previous fourth wave.
I'm now able to sketch out the direction, subdivisions and levels for w.4 in it's entirety. Moving forward, I'll be using this as my analog to guide. My next significant target under this scenario is where w.iii circle =1.618 w. i circle at 1232.5.
Here is the same chart showing what I'll be looking for to confirm that third wave price action is underway.... that is a decisive close below the lower boundary of the channel line (see red bar).
At the 120 min chart level, the first wave of w. iii circle down has reached w. (iii) and I am anticipating that w.(iv) is underway that should complete either in the ON session or tomorrow at 1324. Also note that the previous forth wave terminated at 1326.50. Thereafter another round of selling should draw prices lower. Since labeling the initial subdivisions of an extended wave is difficult it's hard to know with certainty which wave extended and that the labeling I've provided is correct. What we do know is that the steepest part of the decline is the third wave. Should my labeling be correct, as an interim target look for 1300-1303 to provide support. As soon as more price bars can confirm the count, I'll update the intraday chart.
Best of Trading


The wave structure remains corrective from 1309.50. It is possible that w.(iv) completed in a double zig-zag and the fact that price could only reach nearby resistance of .236 is showing that the market is weak.Since the retracement was very small, I'll need to see a print below 1310.75 to confirm that w.(iv0 had ended. If this occurs then look for new lows to 1300-1303.25... otherwise continue to look for a more complex correction to .382 retracement.
ReplyDeleteHi Mike. I am also watching for a possible triangle from where wave 3 ended. Your waves marked a and b of the expanded flat might be a and b of a contracting triangle. The leading diagonal might be wave a of a zigzag which would be the c leg of the triangle.
ReplyDeleteThanks for sharing your work.
Saxby Fox - Thanks for the comment. You are absolutely correct in the fact that the running triangle is still viable. I mentioned that pattern in last weeks edition of Heard On The Street. The beuty is that either interpretation draws prices lower with the expanded flat being the more bearish of the views.
ReplyDeleteHope this helps.