Yesterday I received a DM from a Twitter follower. His concern was that Bernanke's might announce QE3 in his speech and cause the market to rally as in the QE2 announcement. After a brief conversation, I turned my attention to following a market call that I made and then I thought..... there's a great lesson unfolding that illustrates what I had just said in private hours ago. I hope he the saw the post.
This is Part II , that covers the market action since we last spoke. If you missed Part I, click here.
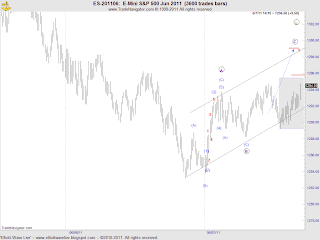
This is the last chart in Part I of the hypothetical trade. At the time there were several warning signs that developed that cause me concern and stops were moved up to 1289 guaranteeing a minimum 3.25 profit per contract if the stop is hit. (see Part I for details).
The market continued to rally in a choppy manner to 1294.75. If a trader was managing the stop as suggested ... the stop should have been 1291.25 at this point.
Here are the final subdivisions for w.iv circle where the wave pattern unfolded as a double zig-zag rather than a simple ABC that was called for in the trade plan. By adopting an alternate count we were able to remain in this trade. The pattern terminated at 1294.75 just below where w.(C) of the second zig zag = w.(A) at 1295.75.
The trade was stopped out at 1291.25 for a profit of 5.25 per contract. If a trader wasn't using the Elliott Wave Principle,working an alternate count, and managing stops.... look what followed! That's why trading what is happening now and what you see is a must for successful trading. The Market provided all the clues to successfully manage this trade all we had to do is watch.
I hope you found this information helpful and best of trading.


Very nicely done. thanks for your time and effort.
ReplyDeleteIlluzhen - your welcome.
ReplyDelete