An educational blogsite dedicated to teaching the Elliott Wave Principle, Fibonacci Ratio Analysis and Market Timing strategies. Primary focus is on the E-mini S&P. Please read the risk disclosures contained within this blog.
Tuesday, March 15, 2011
ES_F: Intraday Chart Update
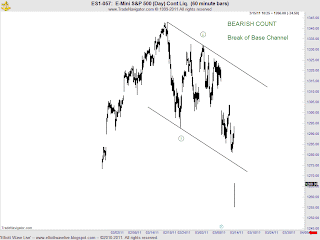
In last nights post, I mentioned that I would become more bearish if price could close below the lower trendline of the base channel. The attached chart shows that price has traded below the channel. Should the market close well below the channel, odds are that a bearish third wave is underway.
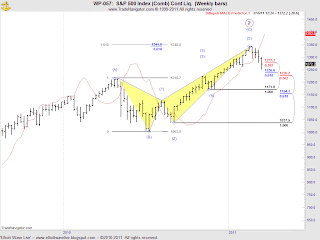
... and here is the weekly chart level. The next area of support below the market remains 1226-36.
Let's see where we close.
Best of Trading
Labels:
Base Channel,
Elliott Wave Analysis
Subscribe to:
Post Comments (Atom)


$ES_F - looking for corrective wave to 129850-129950 agreement and previous 4th of 1 lesser degree in ON session $$
ReplyDelete