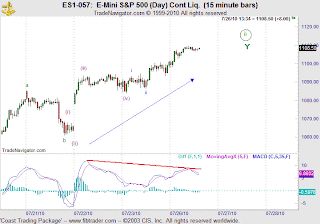
Trade has continued it's march higher but momentum seems to be slowing as measured by the ROC indicator. Price has reached near term resistance between 1108 - 1112. So at the very minimum, I expect to see the market to react to these Fibonacci levels. The extent of any pullback is unknown but there are other clues of near term bearishness building:
- The RSI may now be signaling a top.
- The MACD is showing divergence.
- Small real bodies on candlestick charts.
Will this be the end of wave 2 or do we have more upside? Look for 5 waves down of impulsive nature to confirm that wave 2 has indeed ended.
Best of Trading!


No comments:
Post a Comment