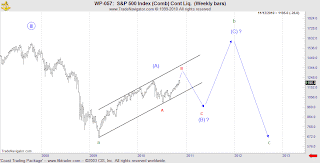
QE2 vs Elliott Wave Theory. Which One Wins Out?
In this weeks review I want to spend some time looking at the bigger picture and other possible wave counts that may provide us with an additional bias as to where the market is heading. Currently I have already presented a scenario under what I will call Scenario #1 whereas Intermediate w.(c) of w.b is still underway with initial targets of 1237-38 or 1343.6. Thereafter, a decline greater than the Great Depression should ensue. This is the "Dooms Day Scenario"
Under Scenario #2: the current rally is viewed as minor w. B of Intermediate w. (B) is unfolding as an expanded flat correction whereas w. B exceeds the origin of w. A. This implies that w.B would extend higher once the current decline that began on 11/9/10 ends. I'll post termination points as soon as they can be identified ... that is if this scenario plays out. Once w. B is complete, a five wave decline would be called for that would terminate significantly below 1003.1, possibly at the 1.382 reverse fibo of the distance between w.A and w.B .
Under Scenario #3: the current wave pattern would unfold in a triangle fourth wave. The current rally whether complete or not should result in a sizable decline in three waves proportionate to a .618 retracement of w.( a - b). This implies a possible decline below 1003.1. Of course much depends on the significances of any further advance. For sake of argument, we'll assume that w.c will terminate below 1003.1. Thereafter w.d and w.e will also unfold in three waves to complete w. IV. Thereafter a new recovery high above w.III would occur.
Conclusion:
Each scenario presented projects that price will make new lows before any rally of significant proportion. When several Elliott patterns like this agree with respect to direction there is obviously a higher probability that price will trade in that direction. I believe that its only a matter of when.
Best of Trading


No comments:
Post a Comment